Evaluation
The test dataset for this project is a private dataset. We only provide the evaluation results for this dataset.
This dataset contains over 20,000 document images that have been "cropped" for localization, covering seven different categories with highly imbalanced quantities. The data includes a large number of images affected by various lighting changes, blurriness, glare, and cropping distortions caused by corner alignment errors.
We only cleaned the "incorrect category labels" in this dataset and then used all the data to evaluate the model's performance.
Evaluation Protocol
AUROC
AUROC (Area Under the Receiver Operating Characteristic Curve) is a statistical metric used to assess the performance of classification models, especially for binary classification problems. The AUROC value ranges from 0 to 1, with a higher AUROC indicating better capability of the model to distinguish between the two classes.
-
ROC Curve
- Definition: The ROC curve is a graphical tool that shows the performance of a classification model at all possible classification thresholds. It is created by plotting the True Positive Rate (TPR) and False Positive Rate (FPR) at different thresholds.
- True Positive Rate (TPR): Also known as sensitivity, calculated as TPR = TP / (TP + FN), where TP is the number of true positives and FN is the number of false negatives.
- False Positive Rate (FPR): Calculated as FPR = FP / (FP + TN), where FP is the number of false positives and TN is the number of true negatives.
-
Calculating AUROC
- AUROC is the area under the ROC curve. It provides a single metric to summarize the model's performance across all classification thresholds.
- Analysis:
- AUROC = 1: A perfect classifier, able to completely distinguish between the two classes.
- 0.5 < AUROC < 1: The model has some ability to distinguish between the classes, with values closer to 1 indicating better performance.
- AUROC = 0.5: No discrimination ability, equivalent to random guessing.
- AUROC < 0.5: Worse than random guessing, but if the model's predictions are reversed, it may perform better.
TPR@FPR Threshold Table
The TPR@FPR threshold table is a widely used key evaluation tool in the field of face recognition. Its primary purpose is to measure the model's performance at different threshold settings. This table is derived from the ROC curve and provides an intuitive and precise method for evaluating model performance.
For example, if the goal is to achieve at least a TPR (True Positive Rate) of 0.9 when the FPR (False Positive Rate) is 0.01, we can use the TPR-FPR threshold table to determine the corresponding threshold and use it to interpret the inference results.
In the implementation of this project, we also use this evaluation method. We chose the performance at FPR = 0.0001 for TPR as the standard, as this criterion helps us better understand the model's performance under specific conditions.
Zero-shot Testing
We adopt a zero-shot testing strategy to ensure that all categories or patterns in the test data have not appeared in the training data. This means that during the training phase of the model, it has not encountered or learned any samples or categories from the test set. This approach aims to evaluate and verify the model's generalization ability and recognition performance when facing completely unknown data.
This testing method is particularly suitable for evaluating zero-shot learning models because the core challenge of zero-shot learning is to deal with categories that the model has never seen during training. In the context of zero-shot learning, the model typically needs to use other forms of auxiliary information (such as textual descriptions of categories, attribute labels, or semantic relations between categories) to build an understanding of new categories. Therefore, in zero-shot testing, the model must rely on the knowledge it has learned from the training categories and the potential relationships between categories to identify new samples in the test set.
Ablation Experiments
-
Global settings
- Num of classes: 394,080
- Num of epochs: 20
- Num of data per epoch: 2,560,000
- Batch Size: 512
- Optimizer: AdamW
- Settings:
- flatten: Flatten -> Linear (Default)
- gap: GlobalAveragePooling2d -> Linear
- squeeze: Conv2d -> Flatten -> Linear
-
Comprehensive Comparison
Name TPR@FPR=1e-4 ROC FLOPs (G) Size (MB) lcnet050-f256-r128-ln-arc 0.754 0.9951 0.053 5.54 lcnet050-f256-r128-ln-softmax 0.663 0.9907 0.053 5.54 lcnet050-f256-r128-ln-cos 0.784 0.9968 0.053 5.54 lcnet050-f256-r128-ln-cos-from-scratch 0.141 0.9273 0.053 5.54 lcnet050-f256-r128-ln-cos-squeeze 0.772 0.9958 0.052 2.46 lcnet050-f256-r128-bn-cos 0.721 0.992 0.053 5.54 lcnet050-f128-r96-ln-cos 0.713 0.9944 0.029 2.33 lcnet050-f256-r128-ln-cos-gap 0.480 0.9762 0.053 2.67 efficientnet_b0-f256-r128-ln-cos 0.682 0.9931 0.242 19.89 -
Comparison of Target Class Numbers
Name Num_Classes TPR@FPR=1e-4 ROC lcnet050-f256-r128-ln-arc 16,256 0.615 0.9867 lcnet050-f256-r128-ln-arc 130,048 0.666 0.9919 lcnet050-f256-r128-ln-arc 390,144 0.754 0.9951 - The more the number of classes, the better the model performance.
-
Comparison of MarginLoss
Name TPR@FPR=1e-4 ROC lcnet050-f256-r128-ln-softmax 0.663 0.9907 lcnet050-f256-r128-ln-arc 0.754 0.9951 lcnet050-f256-r128-ln-cos 0.784 0.9968 - When using CosFace or ArcFace alone, ArcFace performs better.
- After combining with PartialFC, CosFace performs better.
-
BatchNorm vs LayerNorm
Name TPR@FPR=1e-4 ROC lcnet050-f256-r128-bn-cos 0.721 0.9921 lcnet050-f256-r128-ln-cos 0.784 0.9968 - LayerNorm performs better than BatchNorm.
-
Pretrain vs From-Scratch
Name TPR@FPR=1e-4 ROC lcnet050-f256-r128-ln-cos-from-scratch 0.141 0.9273 lcnet050-f256-r128-ln-cos 0.784 0.9968 - Pretraining is necessary and can save a lot of time.
-
Methods to Reduce Model Size
Name TPR@FPR=1e-4 ROC Size (MB) FLOPs (G) lcnet050-f256-r128-ln-cos 0.784 0.9968 5.54 0.053 lcnet050-f256-r128-ln-cos-squeeze 0.772 0.9958 2.46 0.053 lcnet050-f256-r128-ln-cos-gap 0.480 0.9762 2.67 0.053 lcnet050-f128-r96-ln-cos 0.713 0.9944 2.33 0.029 - Methods:
- flatten: Flatten -> Linear (Default)
- gap: GlobalAveragePooling2d -> Linear
- squeeze: Conv2d -> Flatten -> Linear
- Reducing resolution and feature dimensions
- Using the squeeze method sacrifices some performance but reduces the model size by half.
- Using the gap method significantly reduces accuracy.
- Reducing resolution and feature dimensions leads to a slight decrease in accuracy.
- Methods:
-
Increasing Backbone Size
Name TPR@FPR=1e-4 ROC lcnet050-f256-r128-ln-cos 0.784 0.9968 efficientnet_b0-f256-r128-ln-cos 0.682 0.9931 - Increasing the number of parameters decreases performance, which we attribute to the limited diversity of training data. Since our approach cannot provide too much diversity, increasing the number of parameters does not improve performance.
-
Introduction of ImageNet1K Dataset and Knowledge Distillation using CLIP Model
Dataset with CLIP Norm Num_Classes TPR@FPR=1e-4 ROC Indoor X LN 390,144 0.772 0.9958 ImageNet-1K X LN 1,281,833 0.813 0.9961 ImageNet-1K V LN 1,281,833 0.859 0.9982 ImageNet-1K V LN + BN 1,281,833 0.912 0.9984 As the dataset size expands, the original parameter settings can no longer allow the model to converge smoothly.
Therefore, we made some adjustments to the model:
- Settings
- Num of classes: 1,281,833
- Num of epochs: 40
- Num of data per epoch: 25,600,000 (If the model cannot converge smoothly, it may be due to insufficient data.)
- Batch Size: 1024
- Optimizer: AdamW
- Learning Rate: 0.001
- Learning Rate Scheduler: PolynomialDecay
- Setting:
- squeeze: Conv2d -> Flatten -> Linear
- Using ImageNet-1K to expand the number of categories to about 1.3 million, providing the model with richer image variations and increasing data diversity, resulting in a 4.1% improvement in performance.
- Introducing the CLIP model on top of ImageNet-1K during training for knowledge distillation resulted in a further 4.6% improvement in performance over the TPR@FPR=1e-4 benchmark.
- When using both BatchNorm and LayerNorm together, the result can be improved to 91.2%.
- Settings
Evaluation Results
In evaluating the model's ability, we adopt the standard of TPR@FPR=1e-4. However, this standard is relatively strict, and using it in deployment may result in a less optimal user experience. Therefore, we recommend using TPR@FPR=1e-1 or TPR@FPR=1e-2 threshold settings during deployment.
Currently, our default threshold is set to TPR@FPR=1e-2, which we have determined to be a more suitable threshold after our testing and evaluation. The detailed threshold setting table is as follows:
-
lcnet050_cosface_f256_r128_squeeze_imagenet_clip_20240326 results
-
Setting
model_cfgto "20240326" -
TPR@FPR=1e-4: 0.912
FPR 1e-05 1e-04 1e-03 1e-02 1e-01 1 TPR 0.856 0.912 0.953 0.980 0.996 1.0 Threshold 0.705 0.682 0.657 0.626 0.581 0.359 -
TSNE & PCA & ROC Curve
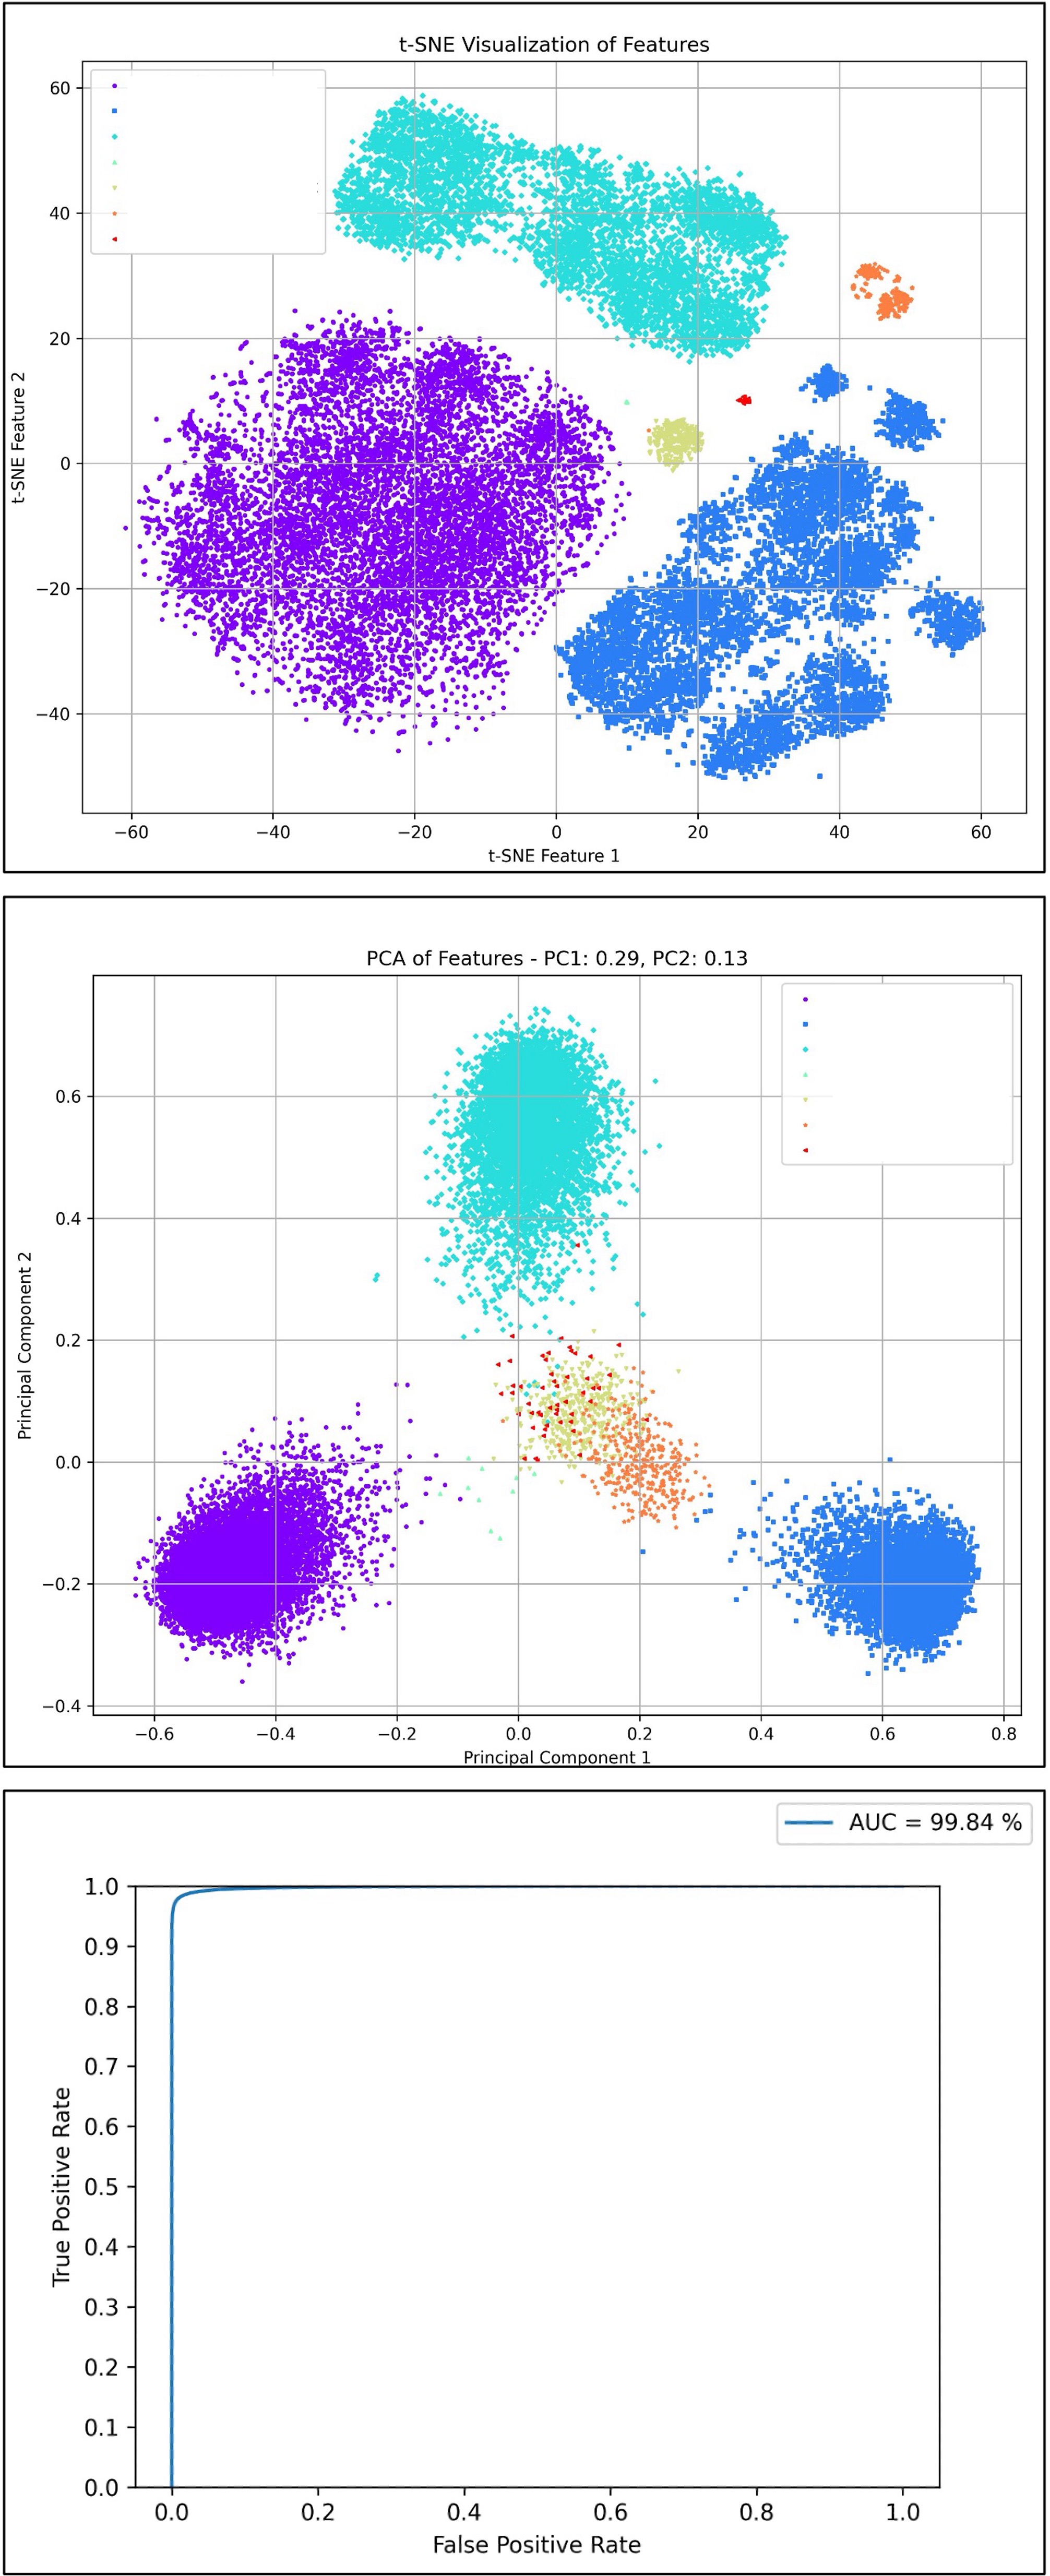
-