Original paper
Performance Measures and a Data Set for Multi-Target, Multi-Camera Tracking
- Publication
- ECCV Workshops 2016Workshop
- First submitted to arXiv
- arXiv:1609.01775
Cite this paper · BibTeX
The citation identifies the linked source version. It cites the original paper and its authors.
@misc{multiobjecttrackingidf12016,
  title = {{Performance Measures and a Data Set for Multi-Target, Multi-Camera Tracking}},
  author = {Ergys Ristani and Francesco Solera and Roger S. Zou and Rita Cucchiara and Carlo Tomasi},
  year = {2016},
  eprint = {1609.01775},
  archivePrefix = {arXiv},
  url = {https://arxiv.org/abs/1609.01775}
}
In the main table of a tracking paper, MOTA almost always has an IDF1 column right next to it.
IDF1 comes from a multi-camera tracking paper. In 2016, Ergys Ristani and Carlo Tomasi of Duke University, Francesco Solera and Rita Cucchiara of the University of Modena in Italy, and their co-authors proposed three things at once in this paper: a new set of evaluation metrics, DukeMTMC, the largest multi-camera dataset of its time, and a reference tracking system.
What happened next was a little unexpected. The dataset was taken down in 2019, and the reference system is rarely mentioned; instead, the paper's metric became standard equipment for single-camera tracking.
Defining the problem
Multi-target, multi-camera tracking (MTMC) has to keep following every person across an entire camera network. A person walks out of one camera's view, passes through a blind spot no camera can see, and reappears in front of another camera, and the system has to recognize that this is still the same person.
The suspect in the airport
The authors use an airport scene to explain what they want to measure.
Security spots suspect A in the main hall and has two tracking systems to choose from. Both systems label the suspect as identity 1 and follow them all the way to the security checkpoint.
- System X makes one mistake at the checkpoint and labels the suspect as identity 2 from then on. Only one mistake, but security has lost the suspect for good.
- System Y, after the checkpoint, flips back and forth between identities 1 and 2. It switches IDs many times, but between the checkpoint and the boarding gate it reports the suspect's position correctly for several stretches, and the total time it's correct is longer too.
Security would pick System Y, because that's the one that let them catch the suspect at the boarding gate. But by CLEAR MOT's counting, System X made one mistake and System Y made many.
As the authors put it, multi-object tracking has traditionally been defined as "keeping track of multiple targets," so existing metrics report "how often a tracker makes which kind of mistake"; but what some users really care about is "at every moment, can we tell who is where."
The authors don't argue that one kind of metric is better. Event-based metrics like CLEAR MOT can point out where errors come from, which suits engineers designing a particular component; in applications where identity is crucial, such as sports analytics, security and surveillance, users need identity-based metrics, regardless of where or why the errors happen.
One person, two identities
First, the problem within a single camera.
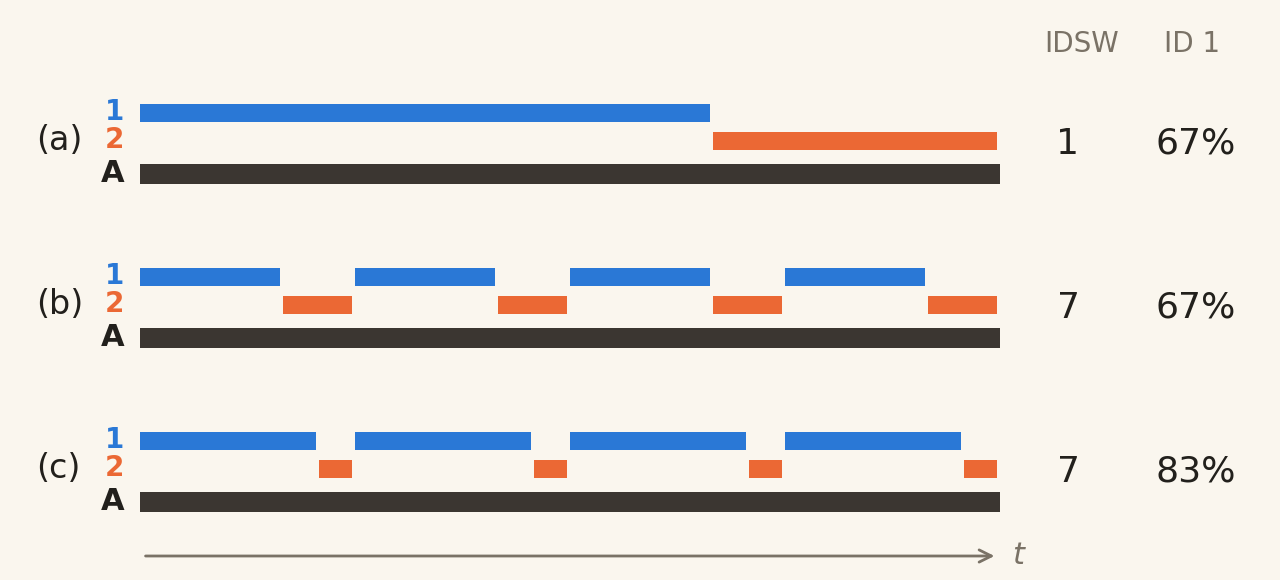
In all three cases, the tracker splits one real person, A, into identity 1 and identity 2.
By an event-counting metric, (a) switches IDs only once, while (b) and (c) both switch 7 times. So (a) is far better than the other two, and (b) and (c) are equally bad.
The authors argue that the tracker really makes only one kind of mistake, which is seeing one person as two. To measure how serious that mistake is, the evaluation first has to decide whether A should correspond to identity 1 or identity 2. Once that's decided, every frame in which A is labeled with the other identity is a frame where the tracker is wrong.
This choice is made by the evaluator, not the tracker, so it should be as favorable to the tracker as possible. In all three cases, mapping A to identity 1 is the most favorable, because identity 1 explains the largest part of A. Then you just count how many of A's frames aren't labeled identity 1, which comes to 33% for both (a) and (b) and 17% for (c).
By this count, (a) and (b) are equally good and (c) is the best, exactly the opposite of the event-count ranking. The tracker knows where A is 83% of the time in (c), and only 67% in (a) and (b).
Swap the thick and thin lines in the figure, and the same reasoning applies to the other kind of mistake, where the tracker merges two real people into a single identity. In that case, you pick for this computed identity the true trajectory it covers the most.
The moment the camera changes
Multiple cameras also bring the problem of handover.
Existing metrics count "handover errors" separately, recording one whenever a person walks from camera I to camera II and the system gives them different identities on the two sides. Whether this counts as a handover error or a within-camera error depends only on which identity the trajectory gets in its last frame in camera I and its first frame in camera II.
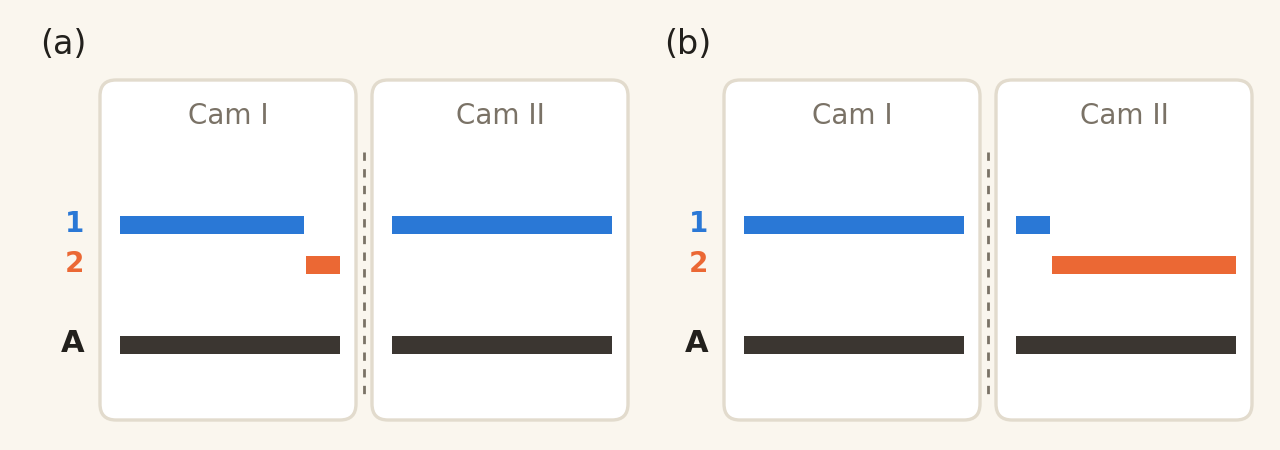
Looking only at the two frames around the handover makes the verdict fragile:
- (a) The handover is actually correct, and A is recognized as identity 1 in both cameras. Just because a short stretch at the end of camera I is wrongly labeled identity 2, existing metrics record both a within-camera fragmentation and a handover fragmentation.
- (b) The handover is actually wrong, and after entering camera II, A is labeled identity 2 almost the whole time. But a short stretch at the start of camera II happens to still be identity 1, so existing metrics consider the handover successful and record only one within-camera fragmentation.
With the authors' new method, (a) is penalized only for the short mislabeled stretch, while (b) is penalized for nearly the entire trajectory in camera II.
MCTA, the composite metric commonly used for multi-camera tracking at the time, multiplies three terms: the detection F1 score, within-camera errors and handover errors. That makes the problem worse. Once a situation like the ones above moves an error from the within-camera term to the handover term, its effect on the score changes drastically, because it gets multiplied by the values of the other two terms. The authors also say plainly that the reason for combining them by multiplication isn't clear.
On top of that, MOTA itself doesn't suit multiple cameras. A trajectory spanning cameras and frames in total has only about links between adjacent frames that cross cameras, and within cameras, with far smaller than . Getting someone wrong across cameras barely shows up in MOTA.
Solving the problem
The authors stop counting how many times errors happen, and instead measure how long the tracker gets the right person.
Whole trajectories, matched one to one
The first step is to pair the true identities with the computed identities.
The unit of matching here is the whole trajectory, and it's one-to-one, so a true trajectory can be paired with only one computed trajectory, and vice versa. The pairing is chosen to minimize the number of mismatched frames summed over all the data.
The authors write this as a bipartite matching problem. On the left goes every true trajectory , on the right every computed trajectory . In addition, each computed trajectory gets an extra "false positive" stand-in on the left, and each true trajectory an extra "miss" stand-in on the right. These two kinds of stand-ins let a trajectory go unpaired with anyone, at the cost of all its frames counting as errors.
When two trajectories "don't match" in a given frame, this is written . In the image, two boxes with an IoU below don't match; in ground coordinates, two positions more than 1 meter apart don't match. When paired with a stand-in, every frame on the other side counts as not matching.
The cost of a pairing is the number of missed frames plus the number of false-positive frames it causes:
and are the frames in which the two trajectories appear.
Once the minimum-cost one-to-one pairing is solved, the result for each frame falls into three categories:
- IDTP: the paired true trajectory and computed trajectory really do match in that frame.
- IDFN: a frame of a true trajectory that isn't matched by the computed trajectory it's paired with (including when it isn't paired with any trajectory at all).
- IDFP: a frame of a computed trajectory that doesn't match the true trajectory it's paired with (including when it isn't paired at all).
Three scores
With these three counts, the usual precision and recall apply:
IDP is the share of computed boxes whose identity is labeled correctly; IDR is the share of true boxes whose identity is recognized correctly. IDF1 is the harmonic mean of the two, and can also be read as "the number of boxes with the correct identity, divided by the average of the number of true boxes and the number of computed boxes."
Let's work one out
Let's walk through a small example. There are two people in the scene, and , present for 10 frames; the tracker outputs two trajectories, and , detects accurately in every frame, and the only problem is that the two trajectories swap once partway through.
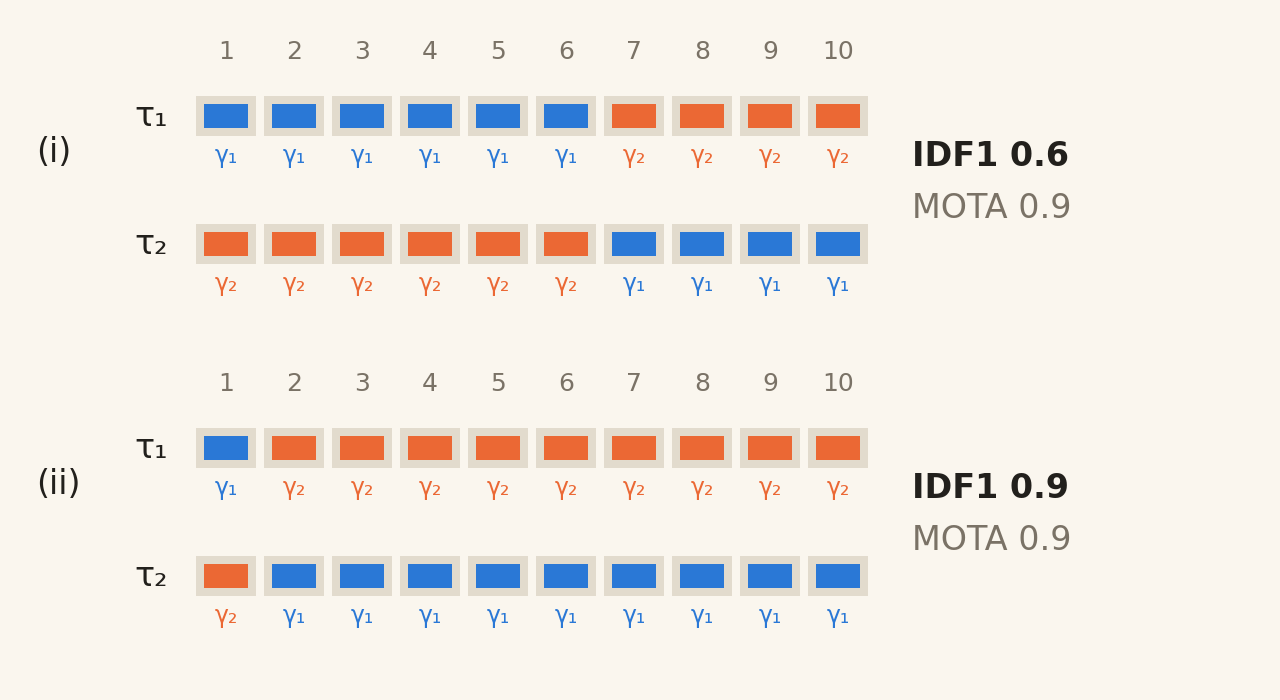
Start with case (i) in the top half, with the swap at frame 7. If is paired with , then isn't matched by in frames 7 to 10, which is 4 missed frames, and goes off to match in frames 7 to 10, which is 4 false-positive frames, for a cost of 8. Pairing it with instead gives 6 wrong frames each, a cost of 12. Pairing with a stand-in costs even more, since all 10 frames of the trajectory count as wrong. The full cost table:
| 8 | 12 | 10 | — | |
| 12 | 8 | — | 10 | |
| 10 | — | 0 | 0 | |
| — | 10 | 0 | 0 |
Compiled for this note. "—" means there is no edge between the two nodes; pairing two stand-ins with each other costs 0.
The minimum-cost pairing is , , with a total cost of 16. So IDFN = 8 and IDFP = 8; the two people have 20 frames in total, so IDTP = 20 − 8 = 12:
Computed with CLEAR MOT, the same example has no misses and no false positives; at frame 7 each of the two people switches hypothesis once, for 2 mismatches, so MOTA .
Now case (ii) in the bottom half, where the swap moves up to frame 2. MOTA is still 0.9, still two mismatches. On the IDF1 side, the best pairing becomes , , each person has 9 matching frames, IDTP = 18, and IDF1 = 0.9. If the swap happens right at frame 6, with 5 frames on each side, IDF1 drops to its minimum of 0.5.
The authors of CLEAR MOT deliberately designed their metric so that "whether the same swap happens early or late" doesn't affect the penalty, and called the opposite approach counterintuitive. In IDF1, by contrast, the moment of the swap determines how long the tracker has the identity wrong, and that's precisely what it wants to measure.
The two metrics parted ways on purpose, right from the start.
How it differs from CLEAR MOT
The authors compare the two side by side:
- The scope of matching. CLEAR MOT matches frame by frame, and keeps the previous frame's pairing as long as it's still within the threshold. Each frame is one-to-one, but over a whole video, one real person may be paired with several trajectories in turn, making it many-to-many. IDF1 matches only once over the whole video, one-to-one throughout.
- No notion of "fragmentation." Since the whole video is matched only once, there are no "ID switch" events to count; it only checks whether each frame is explained by the correct identity.
- The unit of error. IDF1 counts only frames, without mixing in distance. The authors' reasoning is that if you mix binary counts with Euclidean distance, you can't tell whether a tracker "keeps identities right for long" or "follows positions closely."
The authors sum up three properties of this matching: it's one-to-one, it's as favorable to the tracker as possible, and all errors are in the same currency. Overlapping and non-overlapping camera views are handled in exactly the same way.
If you really want to know how hard crossing cameras is, the authors suggest doing the matching twice, once with the data from all cameras pooled together, and once with each camera matched separately and the errors then summed. The former always has at least as many errors as the latter, and the gap between them is the extra errors made by cross-camera association.
DukeMTMC
The paper's second contribution is the dataset.
Eight synchronized static cameras were set up on the Duke University campus and recorded during the crowded periods between classes, 1 hour 25 minutes per camera, at 1080p and 60 frames per second, for more than 10 hours and 2 million frames in total. The footage contains 2,834 different people and 6,791 single-camera trajectories; on average each person has 2.5 single-camera trajectories, and up to 7.
A few numbers show what makes it hard:
- A single camera has 0 to 54 people per frame, depending on the camera.
- There are 4,159 handovers in total, with up to 50 people in blind spots at the same time.
- More than 1,800 occlusions (overlap of 50% or more), lasting 60 frames on average.
- 891 people appear in front of only one camera, a test for trackers prone to wrongly pairing people across cameras.
- Most camera views don't overlap; only two camera pairs share a small overlapping area, which about 100 people pass through.
The annotations are trajectories of each person's foot contact point with the ground. Five people spent a year marking nearly 100,000 key points in a custom-built interface, which were then interpolated to every frame; the image boxes were generated semi-automatically. The first 5 minutes of each camera are used for training and validation, and the remaining 80 minutes for testing.
In their comparison table, the authors list a dozen or so multi-camera datasets known at the time, and even the one with the most identities has only 255. DukeMTMC's 2,834 identities outnumber all the previous datasets combined, and it has the longest recording time and the highest frame rate.
That much data also means that much computation. The authors mention that computing all the foreground masks with a standard algorithm took 6 days on a single machine, and running the DPM detector for all the detections took 7 days on a 192-core cluster.
The authors also list the limitations: there's only one outdoor scene, the cameras are fixed, the soft light of overcast days may make tracking easier, and the views mostly don't overlap, which puts methods that rely on overlapping views at a disadvantage.
The dataset went on to be used heavily, and spawned DukeMTMC-reID for person re-identification. In 2019, Duke University took down the dataset's website. According to a report in the Duke student newspaper, the university said the dataset's release had significantly deviated from the approved research protocol, and it had no plans to make it available again.
The reference system
The third contribution is a reference multi-camera tracker, extended from Ristani and Tomasi's earlier single-camera system.
It merges observations in layers. Detections are first merged into short trajectory fragments, short enough that a simple motion model works; the fragments are then merged into single-camera trajectories; and finally the trajectories from each camera are linked into cross-camera identities. Each layer is a graph whose nodes are observations and whose edge weights, between −1 and 1, express how strong the evidence is that two observations are the same person. Grouping the nodes so that the total weight within groups is maximized is a correlation clustering problem, solved with binary integer programming.
This problem is NP-hard and also hard to approximate, which is why it's split into several layers, keeping each subproblem small enough; over time, a sliding window handles videos that never end.
On the four existing NLPR MCT datasets, following the usual practice of giving the true single-camera trajectories and comparing only cross-camera association, scored with MCTA, this system ranks second on average among six methods.
Discussion
The two kinds of metrics measure different things
The authors run the reference system on DukeMTMC and check whether each true trajectory's ID recall and ID precision are related to the number of fragmentations and merges recorded for it. The four correlation coefficients are −0.24, −0.05, −0.38 and −0.41, all weak.
In other words, how many fragmentations or merges a trajectory racks up tells you little about how much of the time its identity is recognized correctly. Event-based and identity-based metrics really do measure different things.
The handover problem isn't just theory
How common are the two handover counterexamples from earlier in actual results? The reference system made 5,549 handovers on the dataset, and in about 74% of them (4,119), a short trajectory near the handover makes the traditional metrics and the new metrics judge it clearly differently:
| Case | Count | Share |
|---|---|---|
| Correct handover, yet counted as a fragmentation | 1,692 + 738 | 30.5% + 13.3% |
| Correct handover, yet counted as a merge | 1,065 + 496 | 19.2% + 8.9% |
| Wrong handover, yet not counted as a fragmentation | 70 | 1.3% |
| Wrong handover, yet not counted as a merge | 58 | 1.0% |
Compiled from Figure 5 of the paper; the percentages are of all 5,549 handovers, and the first two rows each combine two of the illustrated cases.
Most of the discrepancy is "the handover was done right, and the traditional metrics penalized it anyway."
One system, two rankings
Finally, the authors list the reference system's results on the DukeMTMC test set as a baseline:
| Camera | MOTA | IDP | IDR | IDF1 |
|---|---|---|---|---|
| 1 | 37.36 | 79.17 | 44.97 | 57.36 |
| 2 | 49.17 | 69.11 | 63.78 | 66.34 |
| 3 | 53.50 | 81.46 | 55.11 | 65.74 |
| 4 | 55.92 | 79.23 | 61.16 | 69.03 |
| 5 | 73.09 | 84.86 | 67.97 | 75.48 |
| 6 | 12.94 | 48.35 | 43.71 | 45.91 |
| 7 | 62.03 | 85.23 | 67.08 | 75.07 |
| 8 | 36.98 | 90.54 | 35.86 | 51.37 |
Compiled from the bottom half of Table 3 of the paper, single-camera results; columns such as FP, FN, ID switches, MT and ML are not shown.
The two metrics don't agree on how hard each camera is. By MOTA, camera 3 is easier than camera 2; by IDF1, camera 2 actually comes out slightly better. Cameras 6 and 7 show the disagreement even more clearly, with MOTA differing by nearly 50 points (12.94 vs. 62.03) and IDF1 by only 29 (45.91 vs. 75.07). The authors say that, looking at the actual tracking results, camera 6 isn't as bad as MOTA makes it seem.
On camera 8, IDP is as high as 90.54, but IDR is only 35.86. Most of the identities it labels are correct, but many people never get recognized at all. You can't see this trade-off from IDF1 alone, which is why the authors provide precision and recall as well.
Across all cameras, IDP, IDR and IDF1 are 52.35, 36.46 and 42.98. The table also has a cross-camera row labeled as an upper bound, with an IDF1 of 59.77.
Conclusion
This paper uses an airport example to separate "how often you make mistakes" from "how long you get the right person." IDF1 pairs true identities with computed identities one-to-one over the whole video, making the pairing as favorable to the tracker as possible, and then counts how many frames have the right identity. Every error is priced in frames, whether it happens within a camera or at a handover.
Its split from CLEAR MOT is deliberate. CLEAR MOT holds that one swap is one error, and shouldn't count differently depending on whether it happens early or late; IDF1 holds that an early swap means the tracker reported the wrong person for longer. Each view answers a reasonable question, and the authors have no intention of replacing anyone.
MOTChallenge later put IDF1 on its leaderboard, alongside MOTA. Four years after that, HOTA pointed out that IDF1 had gone to the other extreme, caring almost only about association, with detection quality barely reflected in the score.
Back to the airport. What security wanted was never "how many mistakes," but whether, before the boarding gate, the system could point at the screen and say, "There they are."