Original paper
HOTA: A Higher Order Metric for Evaluating Multi-Object Tracking
- Publication
- International Journal of Computer Vision 2021Journal
- First submitted to arXiv
- arXiv:2009.07736
Cite this paper · BibTeX
The citation identifies the linked source version. It cites the original paper and its authors.
@misc{multiobjecttrackinghota2020,
  title = {{HOTA: A Higher Order Metric for Evaluating Multi-Object Tracking}},
  author = {Jonathon Luiten and Aljosa Osep and Patrick Dendorfer and Philip Torr and Andreas Geiger and Laura Leal-Taixe and Bastian Leibe},
  year = {2020},
  eprint = {2009.07736},
  archivePrefix = {arXiv},
  url = {https://arxiv.org/abs/2009.07736}
}
After a few tracking papers, you're probably very familiar with the number called MOTA. SORT uses it, DeepSORT uses it, and it's the first column of the main tables in Tracktor and FairMOT too.
But we saw in the DeepSORT note that cutting ID switches by 45% raised MOTA by only 1.6 points. FairMOT also ran an experiment in which a model trained only for detection, with re-ID features that were close to random, actually scored a higher MOTA than one trained on both tasks together.
A metric that claims to measure "tracking" seems oddly insensitive to whether the tracker is following the right person.
This paper comes from RWTH Aachen, the Technical University of Munich, Oxford and Tübingen. The authors include maintainers of MOTChallenge as well as Andreas Geiger, who created KITTI. They take MOTA, IDF1 and Track-mAP apart one by one, then propose a new metric, HOTA (Higher Order Tracking Accuracy). To see how much influence the paper had, just look at the main tables in the next few notes. HOTA became the main metric for the generation of papers that includes ByteTrack and OC-SORT.
Defining the problem
Multi-object tracking has to get three things right:
- Detection: in every frame, find the objects that should be found, no more and no fewer.
- Localization: the boxes have to be accurate.
- Association: the same object has to get the same ID at different times, and different objects can't share an ID.
A good metric should reflect all three at once and weight them sensibly. The authors first examine the two most widely used metrics of the time.
MOTA
In every frame, MOTA matches predicted boxes to ground-truth boxes one-to-one (with an IoU of at least 0.5). Matched pairs are true positives (TP), leftover predictions are false positives (FP), and unmatched ground-truth boxes are missed detections (FN). Association errors are counted as ID switches (IDSW): whenever a ground-truth object is matched to a different predicted ID than the one it was matched to last time, that counts as one.
The denominator is the total number of ground-truth boxes.
IDF1
IDF1 doesn't match frame by frame. Instead, it matches whole predicted tracks to whole ground-truth tracks one-to-one, choosing the combination with the most overlap. The overlapping parts of matched tracks count as IDTP, every other ground-truth box counts as IDFN, and every other predicted box counts as IDFP:
One person, two ways of tracking
Let's work through the example from the paper's first figure.
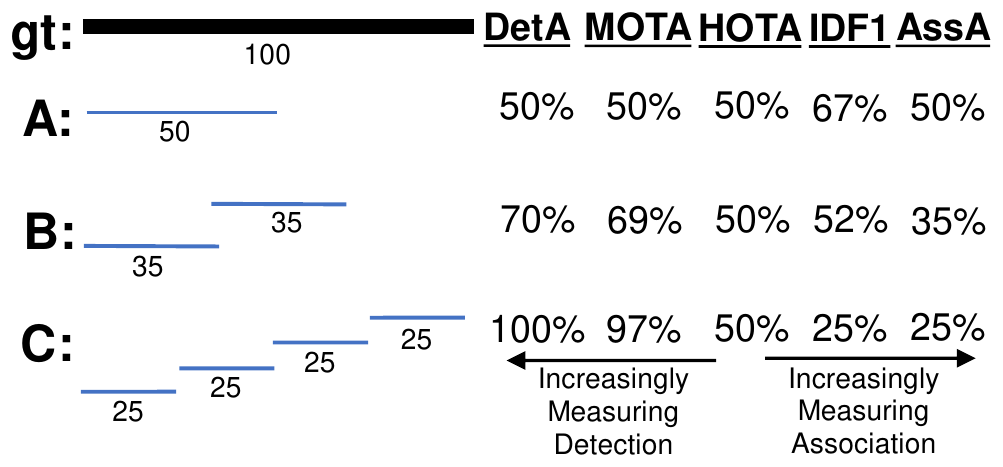
There is only one person in the scene, and they appear for 100 frames. Look at trackers A and C:
- A tracks the first 50 frames with the same ID from start to finish, and misses the last 50 frames completely.
- C tracks every frame, but changes ID every 25 frames, for four IDs in total.
Which one is better?
Start with MOTA. A has 50 missed detections, no false positives and no ID switches, so . C has no missed detections, no false positives and 3 ID switches, so .
MOTA thinks C is far better. Changing IDs three times costs only 3 points.
Now IDF1. A's single track is matched to the ground-truth track, so IDTP = 50, IDFN = 50, IDFP = 0, and IDF1 = . C can match only one 25-frame segment, so IDTP = 25, the other 75 ground-truth boxes are all IDFN, the 75 predicted boxes in the other three segments are all IDFP, and IDF1 = .
IDF1 thinks A is far better. The fact that C tracked every single frame barely counts.
The two metrics each take a side, and both take it to the extreme.
Solving the problem
HOTA's goal is to measure detection, association and localization fairly in a single score, while still letting you break it apart to see where the errors come from.
First, match frame by frame, like MOTA
HOTA matches the same way MOTA does. In every frame, predicted boxes are matched one-to-one to ground-truth boxes, and the localization similarity (IoU, for example) has to reach a threshold . Matched pairs are TP, and the rest are FP and FN.
The detection score is the standard Jaccard index:
Then, for every TP, ask how well its track lines up
The association part is what's new in this paper. For each matched TP, written , the authors define three sets:
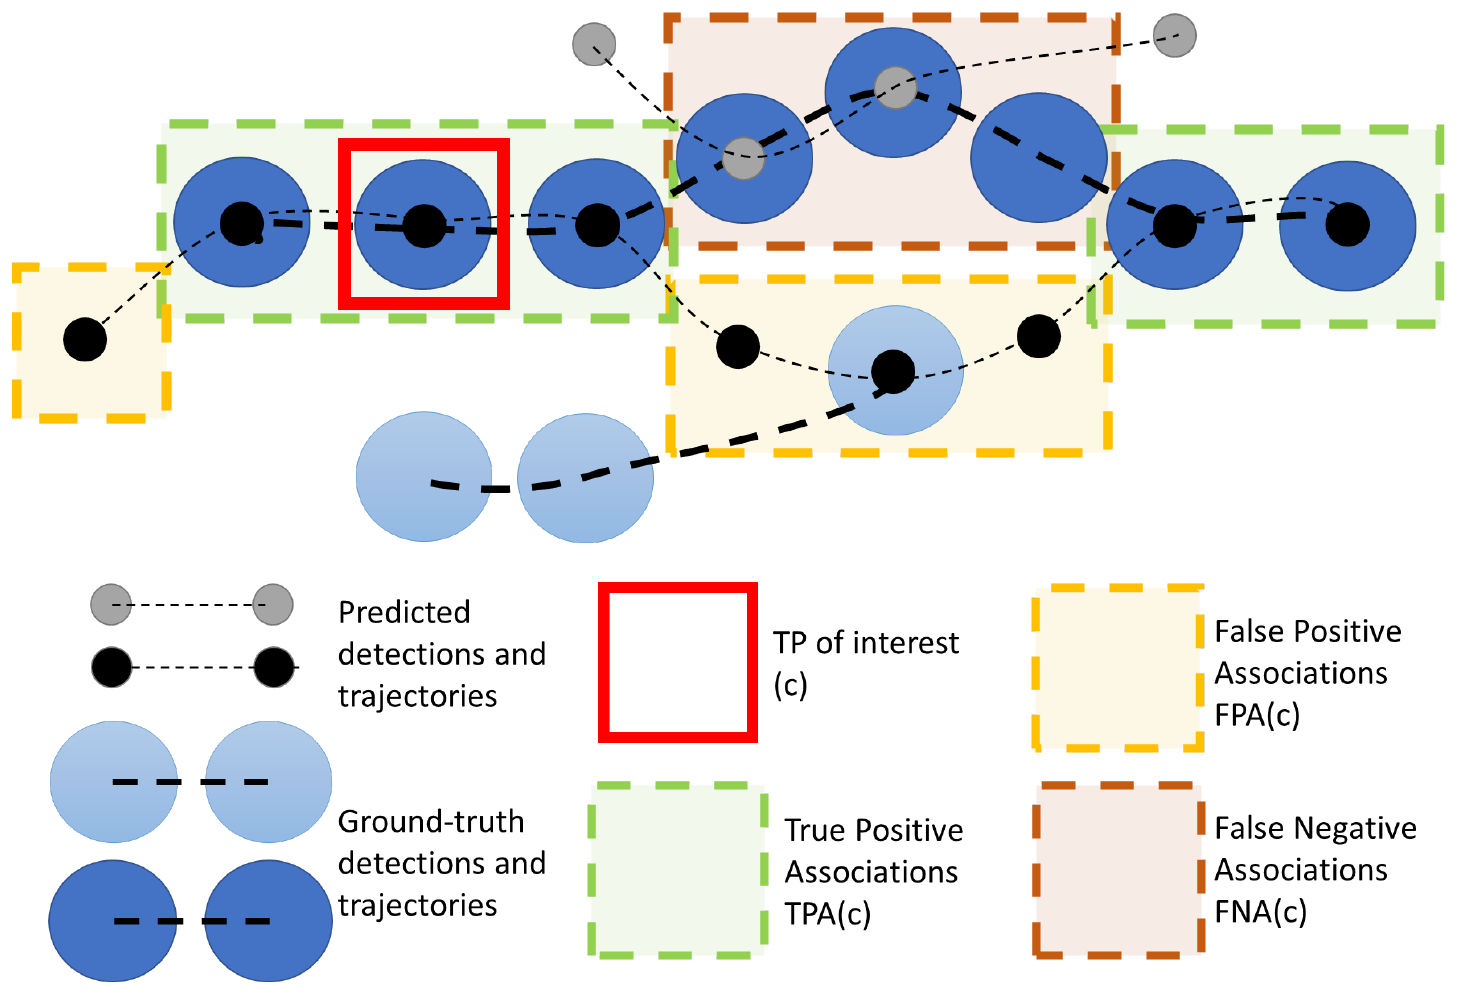
- TPA (True Positive Associations): TPs with the same ground-truth ID as and the same predicted ID. These are the moments when the same person is treated by the tracker as the same person.
- FNA (False Negative Associations): ground-truth boxes with the same ground-truth ID as that were given a different predicted ID or were not detected at all. Same person, but the tracker didn't recognize them.
- FPA (False Positive Associations): predicted boxes with the same predicted ID as that actually belong to someone else or don't correspond to any object at all. The tracker thought it was the same person, but it wasn't.
In the figure, has five TPA, four FPA and three FNA. Its association score is, once again, a Jaccard index:
Plugging in the numbers from the figure:
Averaging the association scores of all TPs gives the association accuracy:
Two scores, combined by geometric mean
The authors call this a "double Jaccard." The outer layer is the detection Jaccard, but in the numerator each TP isn't counted as 1; it's weighted by its own association score.
Back to the example.
A's DetA is . Every TP has 50 TPA, the FNA are the 50 ground-truth boxes at the end that were never tracked, and there are no FPA, so every association score is and AssA is also 50%. HOTA .
C's DetA is 100%. Each TP sits in a segment only 25 frames long, so its TPA is 25. The person's other 75 frames were given other IDs and are all FNA, so every association score is 25% and AssA is also 25%. HOTA .
The two trackers tie. A tracks only half the time but keeps the identity right; C tracks everything but keeps changing IDs. HOTA doesn't favor either one. Both sides take the blame.
Finally, bring localization in too
All of the calculations above are done at a fixed localization threshold . To account for how accurate the boxes are, HOTA is computed once at each of the 19 thresholds and then averaged:
The matching is redone at every threshold. The more accurate the boxes, the more TPs still match at high thresholds, and the higher the final score.
The authors specifically point out that DetA and AssA have to be combined into at each first and only then averaged over ; the order can't be reversed. That's why the HOTA in a paper's table generally won't come out exactly equal to the geometric mean of the DetA and AssA in the same table.
Breaking it down
HOTA can be broken all the way down into five sub-metrics, each corresponding to one kind of error:
- DetRe : missed detections.
- DetPr : false positives.
- AssRe: the average of with the FPA removed. When one person is split into several tracks, AssRe drops.
- AssPr: the average of with the FNA removed. When one track spills over onto several people, AssPr drops.
- LocA: the average localization similarity over all TPs, also averaged over every .
This breakdown lets users decide what to focus on for their application. The authors give examples. Human motion analysis, crowd analysis or sports analysis cares about whether identities were tracked correctly all the way through, so AssRe and AssPr matter more. A driver-assistance system has to find every pedestrian and also can't swerve to avoid people who aren't there, so DetRe and DetPr matter more. In surveillance, a false alarm is usually preferable to a miss.
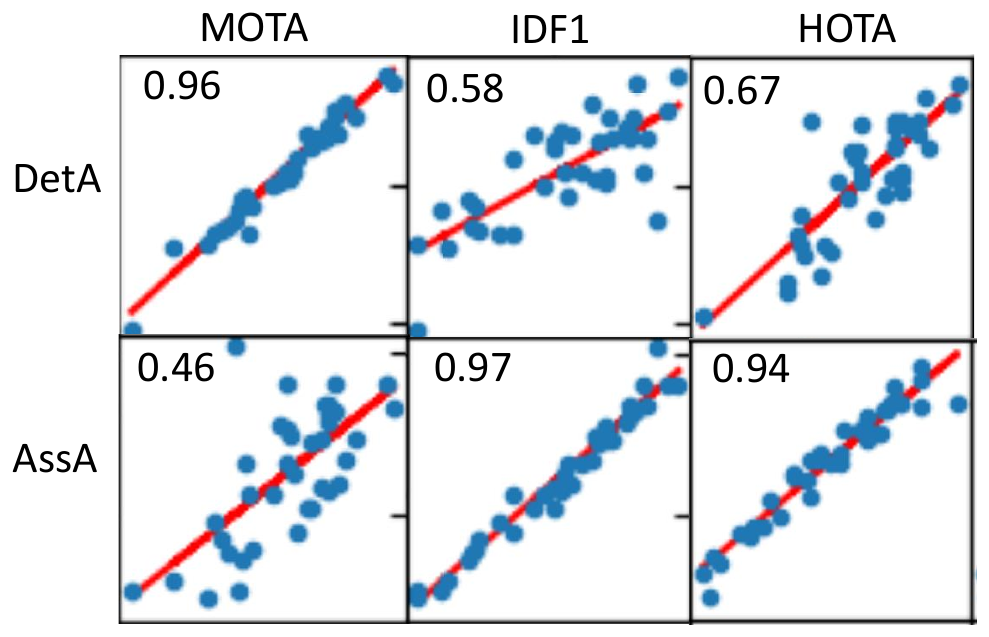
This figure sets the three metrics against DetA and AssA on MOT17. MOTA follows detection almost exclusively () and has only a weak relationship with association (0.46). IDF1 is the exact opposite (0.58 and 0.97). HOTA has a clear relationship with both (0.67 and 0.94).
HOTA's relationship with AssA is stronger, but not because association carries more weight; the two are weighted equally. The reason is that these trackers all use the same set of public detections, so their detection scores are about the same, and the differences between them come mainly from association.
Discussion
Nine problems with MOTA
The authors list nine problems with MOTA. A few of the most convincing ones:
- Detection matters far more than association. Among the top ten trackers on the MOT17 leaderboard on April 1, 2020, the ratio of FN + FP to IDSW ranges from 42.3 to 186.4, with an average of 98.6. The authors also ran a linear regression over 175 trackers. MODA, which looks only at detection (MOTA without the IDSW term), explains 99.4% of the variation in MOTA, while IDSW explains only 23.7%.
- Precision matters far more than recall. With IDSW removed, MOTA can be rewritten as . It's linear in recall but hyperbolic in precision. Lose a little precision and the score drops much more than if you lose a little recall. That encourages everyone to raise the detection threshold, preferring to miss objects rather than report false ones.
- IDSW only looks one step back. An ID switch only checks whether this ID is the same as the previous one; it can't see how well the whole track lines up. If a tracker makes a mistake and then corrects itself, MOTA counts the "correction" as another IDSW, so the tracker is penalized twice.
- ID transfer goes unpunished. If a predicted track jumps from person A to person B, it doesn't count as an IDSW as long as neither A nor B changes ID. The paper's example is a video only two frames long. When one person is split into two tracks, MOTA is 0.5; when two different people are merged into one track, MOTA is a perfect 1.0.
- It depends on frame rate. Take the same 2.5-second track with one ID change in the middle. Evaluated at 40 FPS, the denominator has 100 boxes and MOTA is 0.99; evaluated at 4 FPS, the denominator has only 10 boxes and MOTA is 0.90. HOTA is in both cases.
- It has no lower bound. False positives can increase without limit, so MOTA can fall all the way to negative infinity. When you see a negative MOTA, it's hard to say what it actually tells you.
The problem with IDF1
IDF1 was originally designed for multi-camera tracking. Its core problem is that it allows only one optimal set of track matches. Tracks that aren't chosen, however well they track, have every correct detection in them counted as IDFP, which lowers the score. So IDF1 is not monotonic in detection: better detection can make the score worse.
This also explains why many new benchmarks still chose MOTA. Detection is a very important part of tracking, and IDF1 doesn't measure it well.
Why Jaccard, and why the square root
Section 7 of the paper examines several design choices.
- Jaccard rather than F1 or MODA. The authors use an example to show that only the Jaccard form guarantees monotonicity: one more correct detection always raises the score, and swapping predictions and ground truth gives the same result. F1 ranks a worse result higher at certain length ratios, and MODA isn't symmetric.
- Three jobs for the square root. First, it keeps HOTA's numerical range close to the familiar MOTA and IDF1. Second, it makes HOTA the geometric mean of detection and association, so if either side approaches zero, the total approaches zero. Third, it offsets double counting. The association score already includes the FN and FP within matched tracks, and without the square root those errors would be penalized twice. In single-object tracking, with only one object, DetA and AssA are identical, and after the square root HOTA comes out exactly equal to a single Jaccard index.
- DetA can't be dropped. FN and FP that aren't matched to any track never show up in AssA, so DetA is needed to penalize them. AssA alone also isn't monotonic: add a TP with poor association, and the average goes down.
What people think
Finally, the authors ran a user study. They cut seven MOT17 test videos into 36 clips of 6 seconds each, picked pairs of trackers on which two metrics disagreed, and had participants watch the two tracking results and pick the better one.
A total of 230 people took part, including 62 multi-object tracking researchers and 122 computer vision researchers. In total they compared 2,075 pairs, spending an average of 2 minutes 13 seconds on each.
Leaving out ties, when HOTA was pitted against MOTA, 61.6% of participants sided with HOTA; against IDF1, the figure was 72.0%; MOTA against IDF1 came out roughly 50-50. Among multi-object tracking researchers alone, HOTA's win rate rose to 79.3% against MOTA and 85.9% against IDF1.
Afterward
HOTA was adopted quickly. In February 2021, the KITTI tracking leaderboard switched to ranking by HOTA, with evaluation code from TrackEval, which the authors maintain. New benchmarks such as DanceTrack also use HOTA as their main metric. The ByteTrack, OC-SORT, StrongSORT and BoT-SORT papers we'll read later all put HOTA, MOTA and IDF1 side by side in their main tables.
Some people think HOTA isn't the final answer yet. In 2021, Jack Valmadre and Alex Bewley (yes, the author of SORT) and colleagues at Google Research proposed ALTA, a temporally local tracking metric. Their argument is that many applications can tolerate some degree of association error, and that the relative importance of detection and association should be adjustable, so they use the length of a time window as the adjustment knob. HOTA fixes the split between the two at 50-50. That's one choice, but not the only one.
Conclusion
Match frame by frame first, then for every matched box measure how accurate the association is over the whole track, and finally take the geometric mean of detection and association and average it over 19 localization thresholds. That's HOTA. It breaks down into five sub-metrics: detection recall, detection precision, association recall, association precision and localization.
From now on, when you read the tables in a tracking paper, don't just look at the HOTA column; glance at DetA and AssA too. When a method's HOTA goes up, those two columns tell you at a glance whether it got a better detector or whether association really got stronger.
MOTA says changing IDs three times costs only three points. IDF1 says tracking the whole way through hardly counts.
HOTA says you're both right, and both wrong.