Original paper
Evaluating Multiple Object Tracking Performance: The CLEAR MOT Metrics
- Publication
- EURASIP Journal on Image and Video Processing 2008Journal
Cite this paper · BibTeX
The citation identifies the linked source version. It cites the original paper and its authors.
@article{multiobjecttrackingclearmot2008,
  title = {{Evaluating Multiple Object Tracking Performance: The CLEAR MOT Metrics}},
  author = {Keni Bernardin and Rainer Stiefelhagen},
  year = {2008},
  journal = {EURASIP Journal on Image and Video Processing},
  url = {https://doi.org/10.1155/2008/246309},
  doi = {10.1155/2008/246309}
}
In the main table of a tracking paper, the first column is almost always MOTA.
SORT, DeepSORT and FairMOT all rely on it for their rankings. By the time of the HOTA paper, it was being taken apart and criticized because three ID switches cost only 3 points and almost the entire score is eaten up by detection.
With so many problems, why was it designed this way in the first place?
This time we go back to the source. In 2008, Keni Bernardin and Rainer Stiefelhagen of the University of Karlsruhe in Germany proposed two metrics, MOTA and MOTP. The CLEAR in the paper's title is the name of two international evaluations, held in 2006 and 2007.
Interestingly, what was being evaluated back then was quite different from the pedestrian tracking we know. The main task was to estimate, with several cameras in a seminar room, where on the floor each person was standing, in centimeters. There was also face tracking, pedestrians and vehicles in street scenes, and even acoustic tracking that used microphone arrays to find out who was speaking. Many of MOTA's design choices were forced by these tasks.
Defining the problem
Tracking a single object is easy to evaluate; you just measure the position error in every frame. Multiple objects are harder, because a tracker may output more tracks than there are real objects, or fewer, and the tracks can swap among themselves.
There was no shortage of metrics at the time; what was missing was consensus. The authors survey several existing evaluation schemes:
- Li et al. designed three measures for multi-camera tracking of football players. Two of them only apply to football, and the more general one doesn't consider false-positive tracks or localization error.
- The ETISEO project proposed 8 metrics that depend on one another, and many of them can only be interpreted together with one or two others.
- Smith et al. come closest to this paper's idea, but use 9 measures: 5 for errors in object configuration and 4 for labeling inconsistencies. Some measures are even defined twice, once for trackers and once for objects, such as MT/MO and FIT/FIO.
With that many metrics, and dozens of systems to compare in a large evaluation, readers simply couldn't tell which was better. As a result, many papers skipped quantitative evaluation altogether, or each invented their own.
In the authors' description, the ideal multi-object tracker finds the correct number of objects at every moment, estimates their positions as accurately as possible, and gives each object a single ID that never changes from start to finish, even when the object comes back after a brief occlusion. Contour, orientation and speed are out of scope.
From this they derive the requirements for the metrics:
- They can judge how accurately positions are estimated.
- They reflect whether the tracker consistently follows each object, with exactly one track per object.
- The fewer adjustable parameters and thresholds, the better.
- Intuitive: the numbers still make sense when several kinds of errors occur together, or when errors are unevenly distributed over time.
- General: they can compare 2D and 3D trackers, trackers that estimate only center points, and trackers that estimate boxes.
- Few in number, yet expressive enough.
The first two are goals; the last four are constraints. The genuinely hard part is "how to count errors." If a tracker switches the ID of the same person once over a video, how many errors is that? Think it over before reading on.
Solving the problem
The whole evaluation does three things in every frame:
- Find the best correspondence between the hypotheses the tracker outputs and the real objects .
- For each correspondence, compute the position error.
- Accumulate three kinds of errors: an object matched by no hypothesis is a miss; a hypothesis that corresponds to no real object is a false positive; and when an object is matched to a different hypothesis than before, that counts as one mismatch.
In the end, the tracker's performance is expressed with just two numbers, one for how accurately it estimates positions and one for how many errors it makes in total.
Almost all the details of this procedure are in the first step.
Too far doesn't count
The most intuitive approach is to assign each object to its nearest hypothesis, then count leftover objects as misses and leftover hypotheses as false positives. The first case to handle is when even the nearest hypothesis is far away.
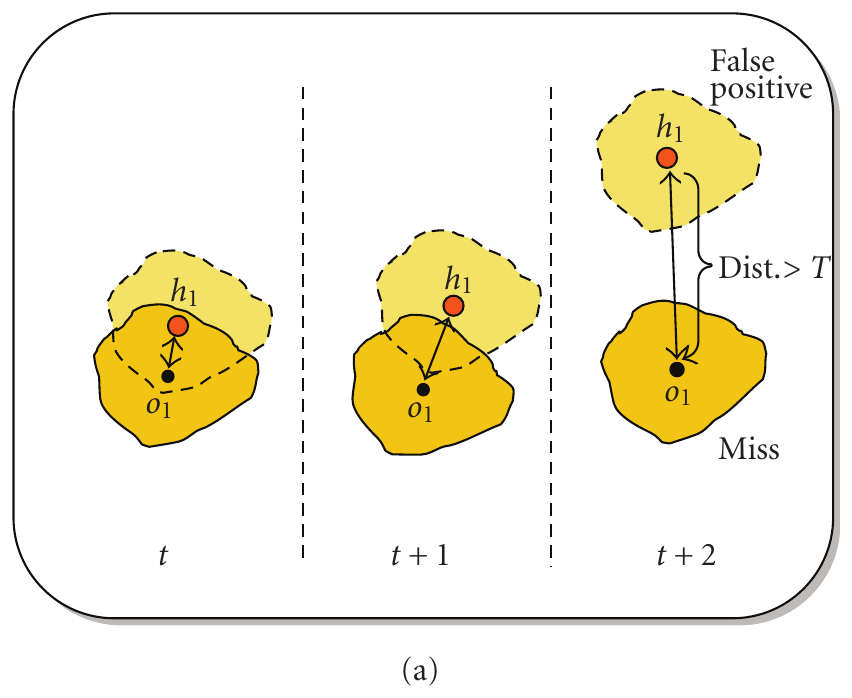
In the figure, drifts upward in the third frame. Is it still tracking ? The authors argue that once the distance gets large enough, you can no longer call it "inaccurate position estimation"; the tracker has lost this object and is tracking something else. So only correspondences with distance count as valid. Beyond the threshold, the object counts as one miss and the hypothesis as one false positive.
How the threshold is set depends on the task and on how distance is computed. Trackers that estimate boxes can use overlap, with the threshold set at "no overlap at all"; trackers that estimate only center points use Euclidean distance, and the threshold can be a person's average width, in pixels or centimeters. The authors say outright that can't be given one universal value for every situation, and this paper doesn't study ways to determine it automatically from data.
Switched people: how many errors?
Next comes consistency over time.
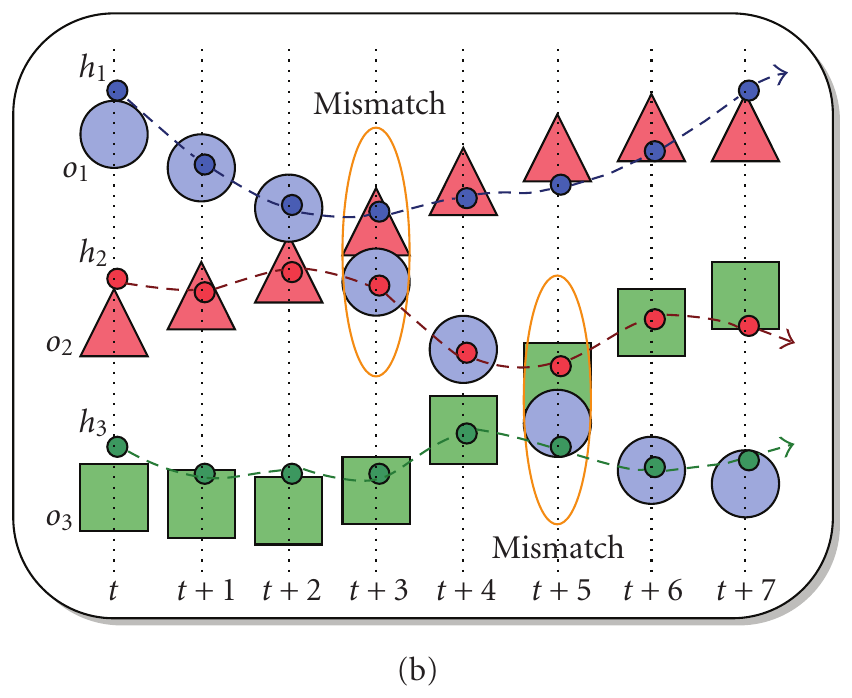
At first, , and follow , and respectively. At , blue and red come together, and after they separate, follows and follows . At , crosses paths with green , and this time follows and follows .
How should these errors be counted?
One idea is to first decide a "best" hypothesis for each object, such as the first one matched to it, or the one matched most often over the whole video, and then count every frame that violates this assignment as an error. The authors use the next figure to show the problem with this approach.
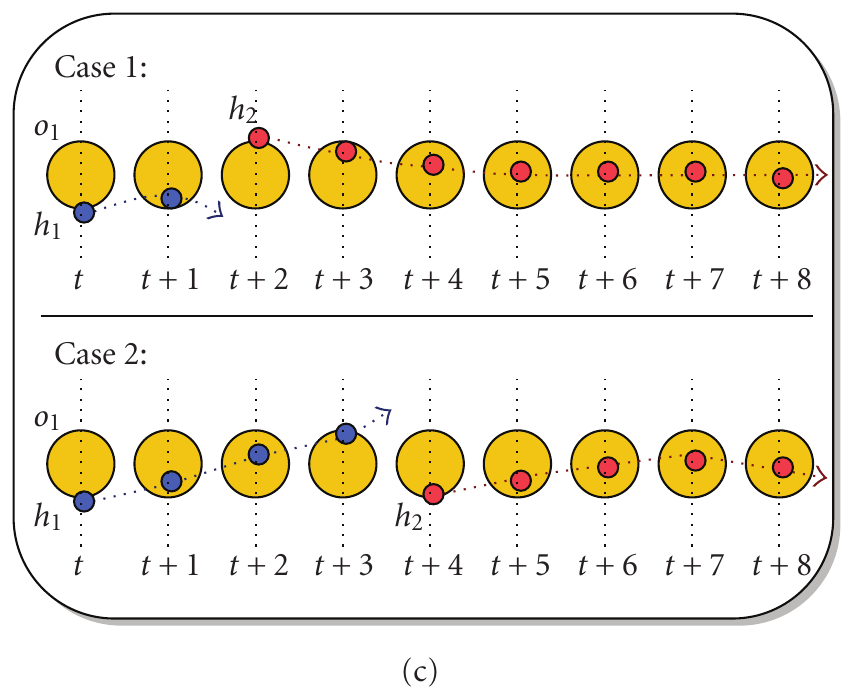
In both cases the hypothesis switches only once, and it's the same kind of error. But is the most often matched hypothesis in both cases, so counting against the "best mapping," Case 1 violates it only in the first 2 frames and gets 2 errors, while Case 2 violates it in the first 4 frames and gets 4 errors. The number of errors depends on whether the switch happens early or late.
The authors instead count one mismatch only in the frame where the correspondence changes, and count the stretches in between as correct. One switch is one error.
Count Figure 2(b) again with this rule. In the crossing at , and each switch hypotheses, which counts as two; at , and each switch once, another two, for four mismatches in total. After that, follows all the way to the end, and isn't penalized in every frame for "following the wrong person."
Remembering who was matched before
To know that "the correspondence changed," you have to remember the earlier correspondences. The authors maintain a mapping table that records all pairings up to time , starting empty, . If at , is matched to , contradicting in the table, that counts as one mismatch, and the pairing in the table is replaced with .
The table also serves a second purpose, deciding which hypothesis to assign when there are several valid choices.
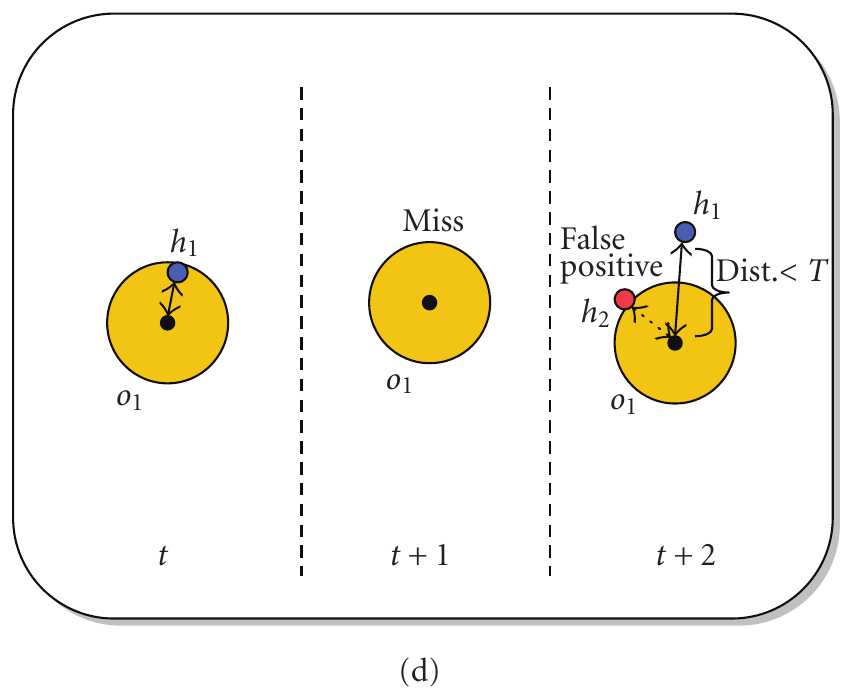
loses track at and comes back at , while a closer appears right next to it. Going by distance alone, should be matched; but the table records , and the authors give priority to keeping that pairing, because it is most likely the correct track. counts as a false positive. It could be an extra hypothesis the tracker output for the same person, or a hypothesis that was tracking someone else and happened to drift over.
The full matching procedure
Putting the designs above together, the procedure for each frame is:
- Keep the old correspondences first. For each pair in the table , if the object is still there, the hypothesis is still there, and the distance doesn't exceed , they're matched directly in this frame.
- Match the rest anew. Among the objects and hypotheses not yet matched, find the pairing with the smallest total distance, under the constraints of one-to-one matching and a distance no greater than . This is a minimum-weight assignment problem, solved with the Munkres algorithm (that is, the Hungarian algorithm). If a new pairing contradicts , update the table and record one mismatch; this frame's number of mismatches is written .
- Compute the distances. This frame has matched pairs in total, and for each pair compute the distance between object and its hypothesis.
- Count the rest as errors. Every unmatched hypothesis is a false positive, of them; every unmatched object is a miss, of them. This frame's number of real objects is written .
- Move on to the next frame. In the first frame the table is empty, all pairings are new, and there are no mismatches.
The first step is the heart of the whole procedure. As long as an old pairing is still valid, it isn't handed to the Hungarian algorithm to be decided again, even if rematching could make the total distance smaller. That way, a tracker that consistently follows the same object is rewarded in the evaluation.
Two metrics
With the per-frame counts in hand, the first metric is multiple object tracking precision (MOTP):
It's the average position error over all matched correspondences. It only answers "when matched, how accurately are positions estimated," and has nothing to do with whether the tracker found the right number of objects or switched IDs. With Euclidean distance, smaller is better; with box overlap, larger is better.
The second metric is multiple object tracking accuracy (MOTA):
The numerator is the sum of misses, false positives and mismatches over all frames, and the denominator is the number of real objects over all frames. Broken apart, it's three error rates added together:
MOTA is 1 minus the total error rate. The authors compare it to word error rate (WER) in speech recognition, which adds up the words that are missing, the extra ones and the misrecognized ones, then divides by the length of the reference.
Word error rate can go above 100%, so naturally MOTA can be negative too. When there are many false positives, the numerator can be larger than the denominator.
Sum first, then divide
In the formula, the sums sit inside the numerator and the denominator separately, instead of computing a per-frame ratio first and then averaging. This order is deliberate.
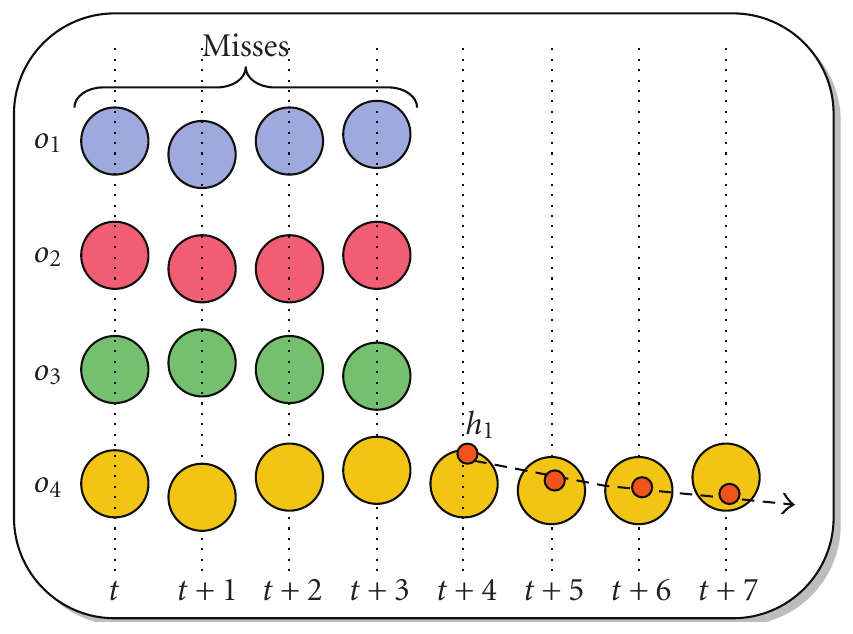
Let's compute a miss rate with this figure.
In the first 4 frames, none of the 4 objects is tracked, so each frame's miss rate is 100%; in the last 4 frames only one object is left, and it is tracked, so the miss rate is 0%. Computing per-frame ratios first and then averaging:
If we sum the errors first and then divide, the first 4 frames miss 16 in total, all 8 frames have objects, and the miss rate is .
This tracker clearly missed most of the objects, yet the per-frame average says it missed half. The authors point out that the false-positive and miss measures of Smith et al. use per-frame averaging, which is why they produce this kind of counterintuitive result.
Putting it to work in the CLEAR evaluations
CLEAR stands for Classification of Events, Activities and Relationships. It was co-organized by the EU's CHIL project, the US VACE project and the US National Institute of Standards and Technology (NIST), and the AMI project joined in 2007. In the 2006 evaluation some tasks still used other metrics; by 2007, every tracking-related task, whether single or multiple objects, video or audio, was evaluated with the MOT metrics.
Different tasks changed only how distance was computed and the threshold:
- 3D visual person tracking: seminar and meeting scenes, with multiple cameras estimating each person's position on the floor. The distance is Euclidean distance on the floor, with a 50 cm threshold. Track merges and splits, common in 2D image tracking, mean little in this multi-camera 3D setting; what needs care instead is telling localization errors, false positives and matching the wrong person apart. The authors say this task drove most of the design of the MOT metrics.
- 2D face tracking: estimate the position and extent of faces in each view. The distance switches to box overlap, with the threshold at no overlap at all.
- 2D pedestrian and vehicle tracking: outdoor traffic scenes, also using box overlap.
- 3D acoustic and multimodal person tracking: use distributed microphone arrays to locate whoever is speaking. Misses and false positives correspond exactly to speech segmentation errors, and MOTP to localization precision. Acoustic tracking doesn't require telling speakers apart, so mismatches aren't counted; this version is called A-MOTA.
Seven systems, three tied
The results of the 2007 3D multi-person visual tracking task:
| System | MOTP | Miss rate | FP rate | Mismatches | MOTA |
|---|---|---|---|---|---|
| A | 92 mm | 30.86% | 6.99% | 1,139 | 59.66% |
| B | 91 mm | 32.78% | 5.25% | 1,103 | 59.56% |
| C | 141 mm | 20.66% | 18.58% | 518 | 59.62% |
| D | 155 mm | 15.09% | 14.5% | 378 | 69.58% |
| E | 222 mm | 23.74% | 20.24% | 490 | 54.94% |
| F | 168 mm | 27.74% | 40.19% | 720 | 30.49% |
| G | 147 mm | 13.07% | 7.78% | 361 | 78.36% |
Compiled from Figure 7 of the paper, CLEAR 2007 3D multi-person visual tracking.
Start with MOTP. Most systems' average localization errors are within 20 cm, which sounds accurate, considering that the ground-truth position is the head center projected onto the floor and is itself only labeled to 5 to 8 cm accuracy. But the authors caution that the 50 cm threshold makes it hard for MOTP to get large, because anything beyond 50 cm is kicked out as a miss, and even if the errors were uniformly distributed within the threshold, MOTP would be only 25 cm. Seen that way, E's 222 mm isn't actually very accurate, while B's 91 mm is quite precise.
Now MOTA. The best, G, is at 78% and the worst, F, at 30%, which you can see at a glance. But systems A, B and C use very different features and algorithms, and yet their MOTA is around 59.6% for all three.
Going by MOTA alone, these three systems are equally good. Break the score down, and B has the most accurate positions and the fewest false positives, but the most misses, and more than twice as many mismatches as C; C misses less, has more false positives and fewer mismatches. The two trackers' strengths are completely different. So the evaluation ultimately decided to publish the three components, misses, false positives and mismatches, alongside MOTP and MOTA.
Mismatches are too cheap
The mismatches in the table are counts, not rates. Behind this lies a problem the authors had already noticed in 2006 and still hadn't solved when the paper came out.
CLEAR's data comes in sequences several minutes long, annotated only once every second. For a reasonable tracker, the number of mismatches is pitifully small compared with the total number of real objects. The mismatch rate is usually under 2%, while misses and false positives run from 20% to 40%. Missing one person for a short stretch costs more than switching IDs several times, so getting identities wrong has very little effect on MOTA.
The authors didn't settle the matter. Whether a wrong identity is a lesser error depends on the application; but the consensus at the evaluation workshops was that identity errors should be given more weight, for example by switching to error measures based on whole trajectories, to get away from a situation dominated by per-frame misses and false positives.
That was written in 2008. Eight years later, IDF1 did its matching over whole trajectories, and four years after that, HOTA split detection and association into two scores. Both were doing exactly this.
Later, MOTChallenge annotated every frame. What follows is this note's speculation. When every frame is annotated, misses and false positives grow in proportion to the number of frames, while one identity swap still counts only once, so the imbalance CLEAR saw back then can only get worse. The HOTA paper's example of "three ID switches costing only 3 points" is this imbalance in miniature.
The threshold decides everything
The parameter has a large effect as well. Set to infinity and a correspondence, once made, stays valid forever no matter how far the hypothesis drifts; MOTA is left meaning only "is the number of objects right," and MOTP loses its purpose. As approaches zero, every object eventually counts as a miss, and both metrics become meaningless.
The 50 cm was set by intuition, and it worked reasonably well. As for how to determine the optimal threshold, the authors say it remains an open question.
Why MOTA can be negative
The 2006 single-person 3D tracking task only tracked the lecturer at the front of the room. The worst system in that table, A, has a MOTA of .
Its average localization error is 246 mm. Misses counted because the distance exceeded 50 cm make up as much as 88.75%, while genuine misses, where no hypothesis was output at all, are only 2.28%.
That's why MOTA goes negative. Every time the localization error exceeds the threshold, the object counts as one miss and the hypothesis as one false positive, so the same error is penalized twice.
The authors say this is intentional. Some trackers use their confidence to simply output nothing when their estimate is poor; others keep outputting wrong positions. The former should come out ahead. As the paper puts it, a tracker that fails to detect the lecturer half the time is better than a tracker that keeps tracking an empty blackboard for the same length of time.
Which kinds of errors there are matters, of course, but how the errors are counted over a time sequence affects a metric's behavior just as much, and that is the paper's most important observation.
In acoustic tracking, likewise, the best system, G, gets an A-MOTA of 54.63%, and the worst, B, . As for 2007 face tracking, the two systems' MOTP (box overlap) is 0.66 and 0.68, so once they find a face they box it equally well; their MOTA, though, is 33.07% versus 68.81%, and the whole difference lies in whether they find the faces and can keep tracking them.
Conclusion
With one explicit matching procedure, this paper sorts multi-object tracking errors into three classes, misses, false positives and mismatches, and summarizes them with two numbers, MOTP for how accurately positions are estimated and MOTA for how many errors there are in total.
Its value lies in the procedure. Beyond the threshold, it isn't a match; an old pairing is kept as long as it's still valid; a mismatch counts once, in the frame where the change happens; rates are summed first, then divided. Every rule has a concrete counterexample backing it up.
The authors saw its problems too, in the evaluations of the day. Three systems with completely different styles can get almost the same MOTA; mismatches are out of proportion to misses and false positives, so wrong identities barely affect the score; and there's no answer for how to set the threshold . Later, MOTChallenge standardized the threshold at IoU 0.5, while the weighting of identity errors wasn't tackled head-on until IDF1 and HOTA.
Next time you see a negative MOTA, don't rush to suspect a bug in the evaluation code. This paper said long ago that a tracker that keeps chasing the blackboard ought to do worse than one that outputs nothing at all.