Original paper
SportsMOT: A Large Multi-Object Tracking Dataset in Multiple Sports Scenes
- Publication
- ICCV 2023Conference
- First submitted to arXiv
- arXiv:2304.05170
Cite this paper · BibTeX
The citation identifies the linked source version. It cites the original paper and its authors.
@misc{multiobjecttrackingsportsmot2023,
  title = {{SportsMOT: A Large Multi-Object Tracking Dataset in Multiple Sports Scenes}},
  author = {Yutao Cui and Chenkai Zeng and Xiaoyu Zhao and Yichun Yang and Gangshan Wu and Limin Wang},
  year = {2023},
  eprint = {2304.05170},
  archivePrefix = {arXiv},
  url = {https://arxiv.org/abs/2304.05170}
}
In a game broadcast, the tracker doesn't have to follow everyone. The audience, the referees and the coaches on the sideline can all be ignored; only the players on the court matter. Once they're tracked, you can work out how far each one ran and how fast on average, and go on to tactical analysis.
Most tracking datasets at the time were built for surveillance or self-driving, with pedestrians and vehicles on the street and nearly everyone in the frame to be tracked. DanceTrack moved to the stage, but its dancers are almost impossible to tell apart, which is also different from what happens on a sports field.
So Yutao Cui, Chenkai Zeng, Xiaoyu Zhao, Yichun Yang and colleagues from Limin Wang's team at Nanjing University built SportsMOT, a tracking dataset specifically for sports scenes, and proposed MixSort, a framework that strengthens appearance association on top of existing trackers.
Defining the problem
The authors argue that all three components of mainstream trackers, detection, motion association and appearance association, have been skewed by the distributions of MOT17, MOT20 and DanceTrack, and don't work very well when moved onto a sports field.
Detection. Pedestrian datasets require detecting nearly everyone in the frame, while on a sports field only the players count, so a specially trained detector is needed.
Motion. Pedestrians in MOT17 and MOT20 walk slowly and in straight lines, so predicting positions with a Kalman filter and then computing IoU works well enough. DanceTrack's dancers frequently change direction and relative position, but they aren't fast. Athletes are both fast and changing speed: sprinting, stopping short, cutting sharply, so the displacement between adjacent frames is large and hard to predict.
Appearance. Pedestrians in MOT17 and MOT20 differ in build and clothing and are easy to tell apart; DanceTrack's dancers dress almost exactly alike. Athletes fall in between. Players on the same team wear the same jersey, and blur when they move fast or the camera pans quickly; but jerseys have numbers, and everyone's posture is a bit different. The authors call this "similar yet distinguishable."
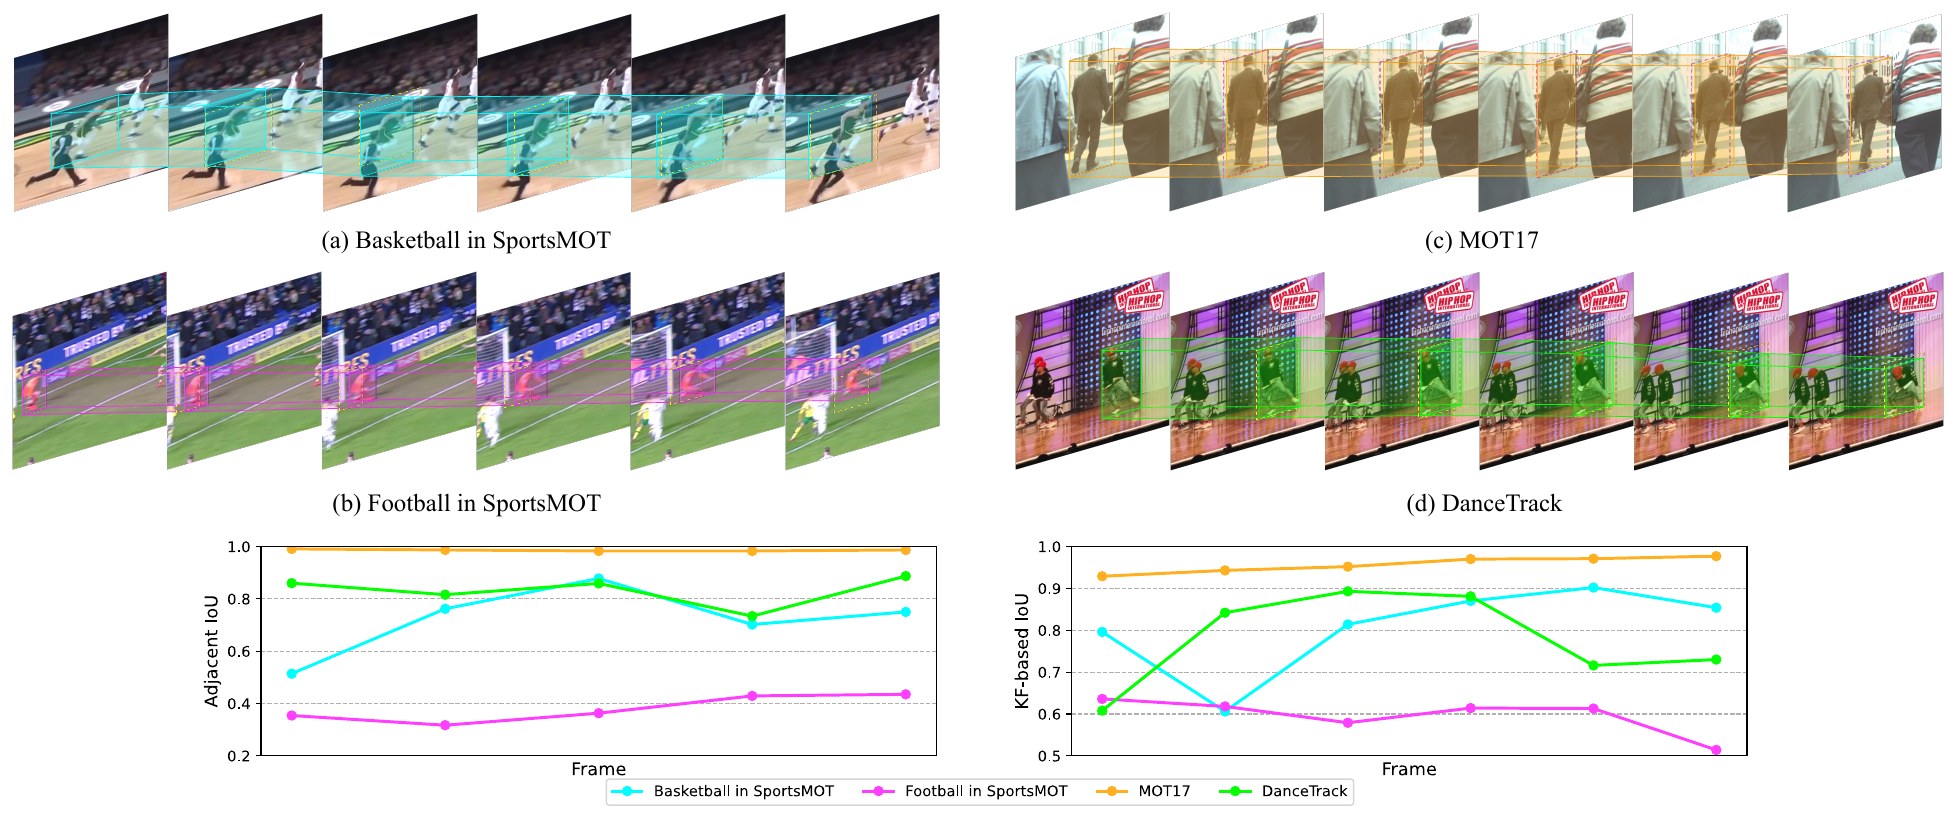
The top half shows the four sampled sequences. In the football one, you can see the same player's box jumping a long way between consecutive frames. In the two line charts below, football's adjacent-frame IoU is only 0.3 to 0.45, and even after Kalman filter prediction it's only 0.5 to 0.65; for MOT17's pedestrians, both are nearly 1.
Solving the problem
Where the data comes from
The authors picked three sports familiar around the world, basketball, volleyball and football, with videos taken from MultiSports, another dataset of sports actions, sourced from professional games including the NCAA, the Premier League and the Olympics. Each of the three sports has its own typical formations and movement patterns.
Selection followed a few conditions:
- Only overhead broadcast shots, avoiding some extreme views.
- All videos are 720p at 25 frames per second.
- Every video was checked by hand to make sure there are no sudden viewpoint changes within a clip.
The annotation rules are also very specific to sports scenes:
- The box covers the player's limbs and torso; a ball touching the body isn't included.
- When a player is occluded, as long as part of the body is still visible, the full box has to be inferred.
- If more than half the torso is outside the frame, it isn't annotated.
- Each player can have only one ID throughout a video.
Annotation used a custom-built tool. When an annotator starts labeling a new player, the tool automatically assigns a new ID and uses the single-object tracker KCF to carry the box to the next frame, where the annotator corrects it. After everything was labeled, a review round fixed boxes and IDs that didn't follow the rules; finally, boxes less than 5 pixels wide or tall were deleted.
Scale
| Dataset | Videos | Frames | Length (s) | Boxes | Tracks |
|---|---|---|---|---|---|
| MOT17 | 14 | 11,235 | 463 | 292,733 | 1,342 |
| MOT20 | 8 | 13,410 | 535 | 1,652,040 | 3,456 |
| DanceTrack | 100 | 105,855 | 5,292 | — | 990 |
| SportsMOT | 240 | 150,379 | 6,015 | 1,629,490 | 3,401 |
Compiled from Table 1 of the paper.
SportsMOT has 13.4 times as many frames as MOT17, and about as many boxes as MOT20, but spread across 240 videos. Training, validation and test have 45, 45 and 150 videos respectively, so the test set makes up the majority.
The three sports also differ a lot:
| Sport | Avg. frames | Avg. tracks | Avg. track length | Avg. gap | Boxes per frame |
|---|---|---|---|---|---|
| Basketball | 845.4 | 10 | 767.9 | 68.7 | 9.1 |
| Volleyball | 360.4 | 12 | 335.9 | 38.2 | 11.2 |
| Football | 673.9 | 20.5 | 422.1 | 116.1 | 12.8 |
Compiled from Table 2 of the paper; all values are per-video averages, with lengths in frames.
Basketball averages 10 tracks per video, exactly the 10 players on the court, and they stay in the frame almost from start to finish. A football pitch is large and the camera only captures some of the players, so there are 20.5 tracks per video on average, with the longest gaps too, as players often run out of the frame and come back.
Measuring the two traits
The authors use three figures to quantify the two traits described above.
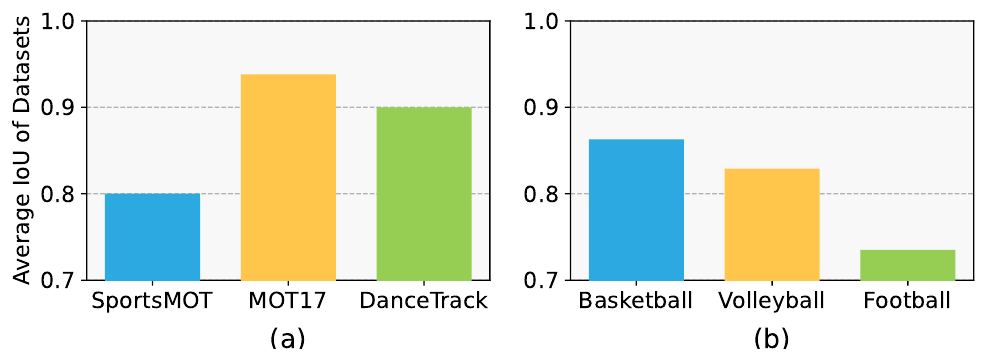
The first measures speed. The less the same person's boxes overlap between two adjacent frames, the faster they're moving. SportsMOT is the lowest of the three datasets, at about 0.80; among the three sports, football is the lowest, at about 0.74.
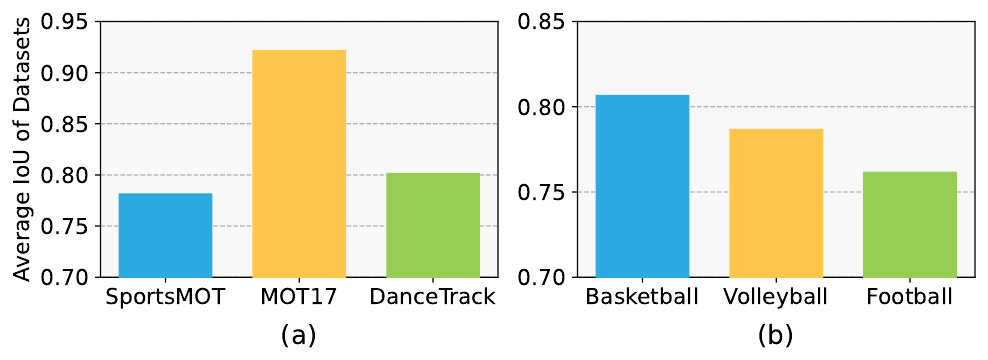
The second measures how predictable the motion is. The authors use the ground-truth boxes from the previous few frames to have a Kalman filter predict the next frame, then compute the IoU against the actual next frame. If motion were constant-velocity, the prediction should be very accurate and the IoU close to 1. SportsMOT is again the lowest, at about 0.78, similar to DanceTrack; MOT17 gets 0.92. The authors attribute this to changing speed, since with sharp acceleration and sudden stops the constant-velocity assumption can't keep up.
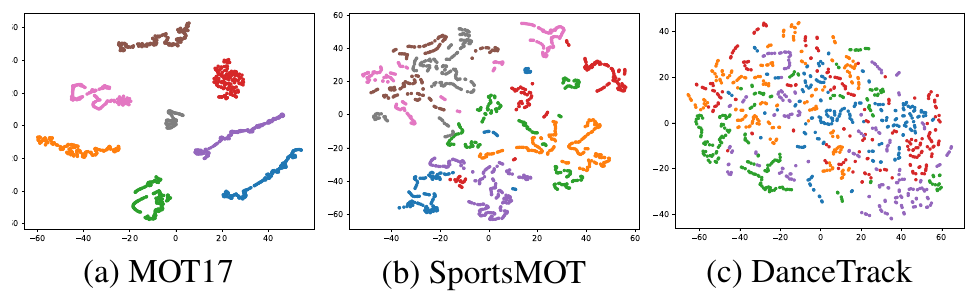
The third looks at appearance. Projecting re-ID features onto a plane with t-SNE, each person in MOT17 forms a cluster of their own, everyone in DanceTrack is mixed together, and SportsMOT sits in between. That's "similar yet distinguishable."
For evaluation metrics, the authors recommend HOTA, AssA and IDF1 as the main ones, rather than ranking by MOTA, which leans toward detection.
MixSort: a single-object tracker for comparing appearance
Since athletes are "distinguishable," appearance should be useful. But ordinary re-ID features turn each box into a vector on its own and then compare distances. The authors' idea is to borrow the approach of single-object trackers instead, taking the track's template and looking for the person directly in the new frame.
They use MixFormer, a single-object tracker the same team had proposed earlier, and turn it into an appearance association module that can be attached to detect-then-associate trackers such as ByteTrack and OC-SORT. They call it MixSort.
For each track, the procedure is:
- Use the Kalman filter to predict its position in this frame, and crop a 224 × 224 search region centered on that position.
- Feed the search region together with this track's template (96 × 96) into MixFormer, which outputs a heatmap indicating how much each position in the search region looks like the template's center.
- For detection boxes whose center falls inside the search region, the heatmap value at that center is the appearance similarity; for those outside the search region, the similarity is 0.
This gives an appearance similarity matrix , which is then combined with the IoU matrix by weighting:
Finally, the Hungarian algorithm does the matching.
To fit multi-object tracking, the authors made a few changes. The original MixFormer uses a corner head to predict the target's top-left and bottom-right corners; here it's replaced with a heatmap head that predicts the target's center. The mixed attention modules are cut from 12 layers to 4 for speed. Each track keeps only one template, and when a new detection is matched, the template is updated only if enough of the new detection's area isn't blocked by other detections, so that occluded frames don't contaminate the template.
For training, each player's track is converted into the single-object tracking data format, a Gaussian distribution generates the ground-truth center heatmap, and the model is trained with focal loss. MixFormer starts from weights trained on single-object tracking data and is fine-tuned on SportsMOT for 300 epochs. The detector reuses ByteTrack's YOLOX, first trained on CrowdHuman and then on SportsMOT.
Discussion
The hard part is association
The authors retrained and tested several mainstream trackers on SportsMOT:
| Method | HOTA | AssA | DetA | IDF1 |
|---|---|---|---|---|
| FairMOT | 49.3 | 34.7 | 70.2 | 53.5 |
| GTR | 54.5 | 45.9 | 64.8 | 55.8 |
| QDTrack | 60.4 | 47.2 | 77.5 | 62.3 |
| CenterTrack | 62.7 | 48.0 | 82.1 | 60.0 |
| TransTrack | 68.9 | 57.5 | 82.7 | 71.5 |
| ByteTrack | 64.1 | 52.3 | 78.5 | 71.4 |
| OC-SORT | 73.7 | 61.5 | 88.5 | 74.0 |
| MixSort-Byte | 65.7 | 54.8 | 78.8 | 74.1 |
| MixSort-OC | 74.1 | 62.0 | 88.5 | 74.4 |
Compiled from Table 3 of the paper, test set. The first five methods use only the training set; ByteTrack, OC-SORT and the two MixSort variants use the training plus validation sets.
Detection DetA is mostly between 77 and 88, while association AssA falls between 35 and 62. From this the authors conclude that SportsMOT's main challenge is association, not detection. The players are clearly visible in the frame and not crowded, so a detector only has to learn not to box the audience and the referees to do well.
MixSort helps both base trackers. Added to ByteTrack, it gains 1.6 HOTA and 2.7 IDF1; added to OC-SORT, only 0.4. HOTA across methods ranges from 49 to 74, a big spread, which the authors take to mean SportsMOT is better at separating different algorithms.
The Kalman filter actually holds things back
The most surprising result in this paper is the MixSort-Byte ablation:
| IoU | Kalman pred. | MixSort | HOTA | AssA | IDF1 |
|---|---|---|---|---|---|
| ✓ | 71.5 | 58.1 | 71.2 | ||
| ✓ | 64.2 | 48.7 | 63.9 | ||
| ✓ | ✓ | 64.1 | 52.3 | 71.4 | |
| ✓ | ✓ | 73.8 | 61.6 | 74.4 | |
| ✓ | ✓ | ✓ | 65.7 | 54.8 | 74.1 |
Compiled from Table 6 of the paper, SportsMOT test set. Rows without Kalman prediction compute IoU directly between the track's last position and the detection box.
The first and third rows differ only in whether the Kalman filter predicts the position first. Without prediction, computing IoU directly with the previous frame's box, HOTA is 71.5; with Kalman filter prediction, it actually drops to 64.1.
A Kalman filter that assumes constant velocity predicts so badly for athletes that you're better off not predicting at all. The best combination in the table is IoU plus MixSort without the Kalman filter, at 73.8 HOTA, 8 points higher than the MixSort-Byte the authors report in the main table (65.7).
Using only MixSort's appearance and ignoring position entirely gives a HOTA of just 64.2, with as many as 25,947 ID switches (IoU alone has 4,329). Appearance can tell people apart, but appearance alone isn't enough.
When appearance helps
The authors tune the fusion weight on OC-SORT plus MixSort and look at how each of the three sports responds. means motion only, and means appearance only:
| Sport | Motion only | Best fusion | Appearance only |
|---|---|---|---|
| Basketball | 65.9 | 66.2 (α = 0.8) | 26.9 |
| Volleyball | 76.0 | 76.9 (α = 0.5) | 40.9 |
| Football | 71.9 | 73.2 (α = 0.4) | 65.7 |
Compiled from Table 4 of the paper, SportsMOT test set, HOTA.
In all three sports, fusion is best, and motion alone always beats appearance alone. The gain from appearance is largest for football (+1.3), then volleyball (+0.9), and smallest for basketball (+0.3). Comparing with the earlier figure, football has the lowest adjacent-frame IoU and the fastest motion. The authors conclude that the faster the motion in a scene, the more it needs appearance cues; the best drops accordingly, with football giving motion a weight of only 0.4.
Basketball is the hardest of the three. Its best HOTA is only 66.2, and with appearance alone just 26.9. The authors suspect that the court is small and there's a lot of physical contact, so occlusion and blur are both more severe.
Against DanceTrack and SoccerNet
On the DanceTrack validation set, MixSort-Byte's HOTA is 46.7, versus 47.1 for the original ByteTrack, so adding appearance actually makes it slightly worse. The dancers are too hard to tell apart by appearance, and the appearance module can't help. SportsMOT's players look similar but can be told apart, so both motion and appearance cues have to be used.
SoccerNet, another sports tracking dataset, covers only football and requires tracking everything on the pitch, including players, goalkeepers, referees and the ball. MixSort-Byte's HOTA on SoccerNet is 62.9, with a DetA of only 71.5, lower than the 78.8 on SportsMOT, because there's a wider mix of things to detect; but its AssA is 55.5, actually slightly higher than SportsMOT's 54.8. From this the authors conclude that association on SportsMOT is more challenging.
Finally, the authors also compare MixSort with an ordinary re-ID model. Adding the re-ID model used by DeepSORT to ByteTrack and fine-tuning it on SportsMOT raises HOTA from 64.1 to 64.8; switching to MixSort brings it to 65.7. Appearance cues really are useful, and comparing appearance with a single-object tracker is a bit better still.
Conclusion
With 240 broadcast videos of professional games, SportsMOT presents a tracking setting unlike either pedestrians or dancers, in which players run fast and change speed, and look similar but can be told apart. The authors quantify these two traits with adjacent-frame IoU, IoU after Kalman prediction and the distribution of re-ID features, and show that the difficulty here lies mainly in association.
MixSort shows that appearance cues really are useful on a sports field, but the thing in this paper most worth remembering is that ablation table. A Kalman filter with a constant-velocity assumption not only fails to help with athletes, it knocks 7.4 points off HOTA.
Two months later, Deep-EIoU, which also deals with sports scenes, simply removed the Kalman filter altogether and reached 77.2 HOTA on SportsMOT. A 2025 survey of multi-object tracking also lists SportsMOT alongside MOT17, MOT20 and DanceTrack as the four standard datasets.
All the players on the court wear the same jersey. Luckily, there's a number on the back.