Original paper
A Systematic Study of In-the-Wild Model Merging for Large Language Models
- Publication
- Transactions on Machine Learning Research 2026Journal
- First submitted to arXiv
- arXiv:2511.21437
Cite this paper · BibTeX
The citation identifies the linked source version. It cites the original paper and its authors.
@misc{modelmerginginthewildmerging2025,
  title = {{A Systematic Study of In-the-Wild Model Merging for Large Language Models}},
  author = {Oğuz Kağan Hitit and Leander Girrbach and Zeynep Akata},
  year = {2025},
  eprint = {2511.21437},
  archivePrefix = {arXiv},
  url = {https://arxiv.org/abs/2511.21437}
}
Model-merging papers usually design tidy experiments. Each expert is fine-tuned on a distinct task, such as eight image-classification datasets or seven NLP tasks, and the merge is tested on those tasks individually.
The real world is messier. Open Hugging Face and a single Llama or Qwen base may have hundreds or thousands of community fine-tunes. Some do mathematics, some role-play, and some simply use another instruction dataset. Their objectives can overlap or conflict. The fine-tuned models accumulated within a company may look much the same.
Oğuz Kağan Hitit, Leander Girrbach, and Zeynep Akata from Koç University, the Technical University of Munich, Helmholtz Munich, and MCML ask a practical question: can merging these “wild” fine-tunes produce a model better than its base, or even better than every individual fine-tune?
Defining the problem
The paper defines its objective precisely. It merges heterogeneous, potentially conflicting fine-tunes and evaluates general language-model ability, only partly covered by the sources' individual training tasks.
The authors ask three questions:
- Can simply merging multiple fine-tunes outperform the base model?
- Which weight-interpolation-based merging methods can achieve this?
- Do “subspace” merging methods that recently performed well on vision models also work for in-the-wild LLM merging?
A merge beating both the base and individual fine-tunes offers evidence of what the paper calls constructive interference. Evaluation has two comparisons: against the base, and against the fine-tune with the highest average score in the entire pool. This strongest fine-tune is a fixed reference and may be absent from a particular sampled subset.
Solving the problem

This paper also introduces no new method. Its contribution is a repeatable evaluation protocol.
Bases and fine-tunes: four open-weight models, Llama-3.2-3B-Instruct, Llama-3.1-8B-Instruct, Qwen3 4B, and Qwen3 8B, each paired with 12 public Hugging Face fine-tunes covering different objectives and domains. The Llama sources start from Instruct models. Each family shares its own base; the four families are not mixed with one another.
Merging methods: six methods in two groups. The task-arithmetic family includes task arithmetic with , TIES-Merging with and the largest 10% of values retained per layer, and Model Stock. The subspace family includes TSV-Merge, Iso-C, and Subspace Boosting. All use mergekit, with hyperparameters selected beforehand in the appendix and then fixed.
Sampling: the number of fine-tunes is 2, 4, 6, 8, 10, or 12. Because there are too many combinations, the authors uniformly sample 15 subsets per , except , which has only one. Every method uses the same subsets, isolating algorithmic differences.
Evaluation: lm-evaluation-harness runs 16 standard Open LLM Leaderboard benchmarks, including ARC, HellaSwag, Winogrande, MMLU, GPQA, BBH, MMLU-Pro, and TruthfulQA, without chat templates, reporting accuracy.
Most tasks use 0-shot prompting; BBH uses 3-shot and MMLU-Pro 5-shot. Evaluation uses float16, with batch size selected automatically by the harness. This fixes prompting for multiple-choice and knowledge tests, while leaving complete conversations, tool use, and specific role-playing requirements unmeasured. A fine-tune weaker on the average score may still serve its original purpose better.
Match task-arithmetic scales first
One easily missed setting is that mergekit normalization is enabled. For source , let its difference be and recipe weight . The actual merged update is
With and , this averages task deltas. Directly summing twelve fine-tunes' deltas would produce an update twelve times larger. Reproduction requires the normalization setting as well as “TA, .”
The appendix measures this too. With normalization enabled, performance is fairly flat as ranges from 0.1 to 1.9, degrading clearly only at 10. Without it, increasing quickly hurts performance even within the ordinary search range. This gives “simple task arithmetic is most reliable” a more precise operational scope: the result uses averaging and scaling.
Both original plots use horizontally and mean accuracy vertically, with colors for the four bases. The upper plot enables normalization and adds at the far right; the lower disables it. Horizontal positions represent listed coefficient settings, whose actual spacing differs, especially between the two rightmost points.
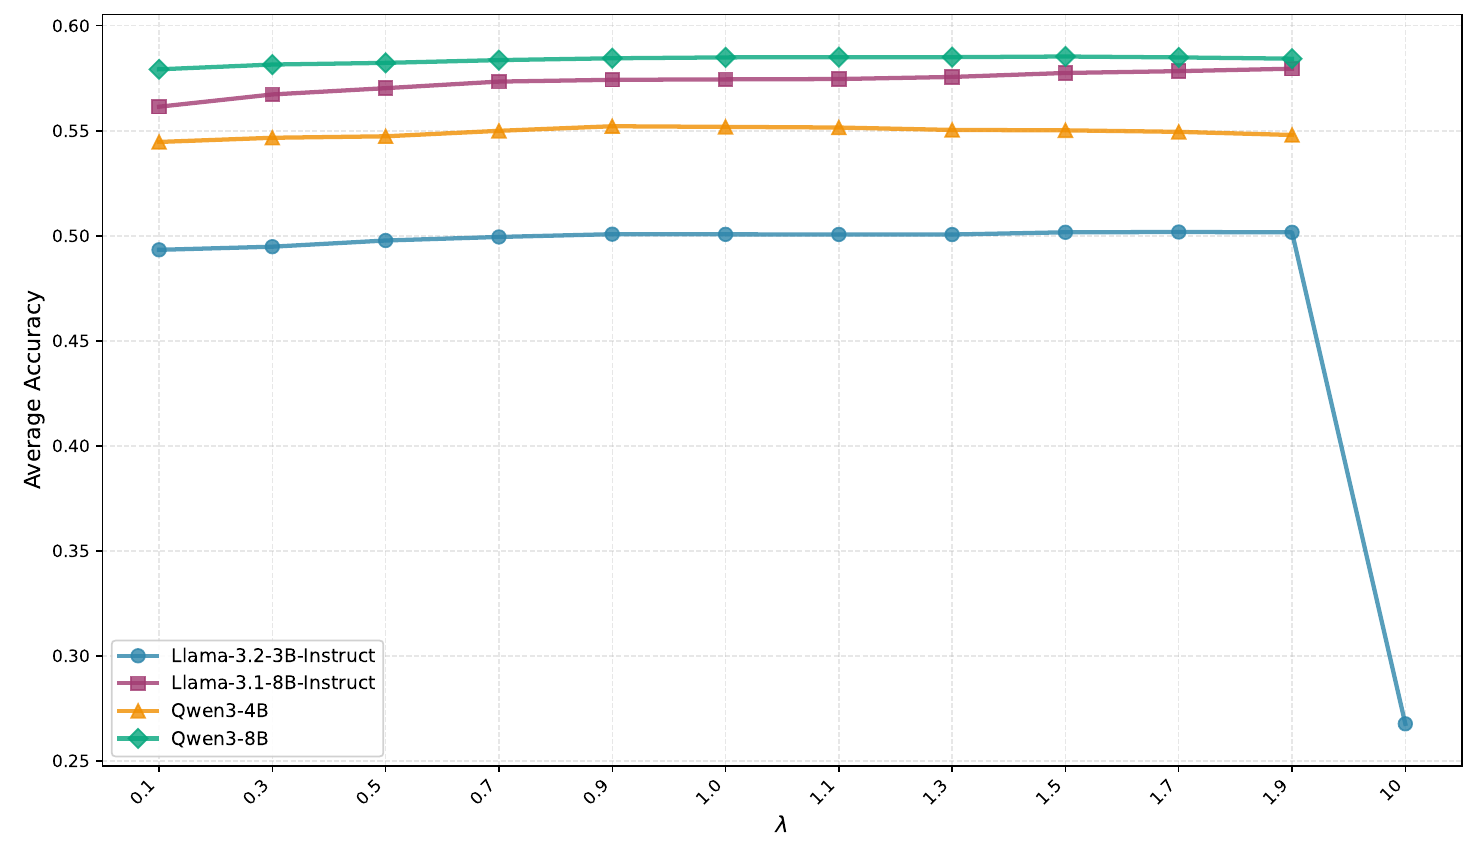
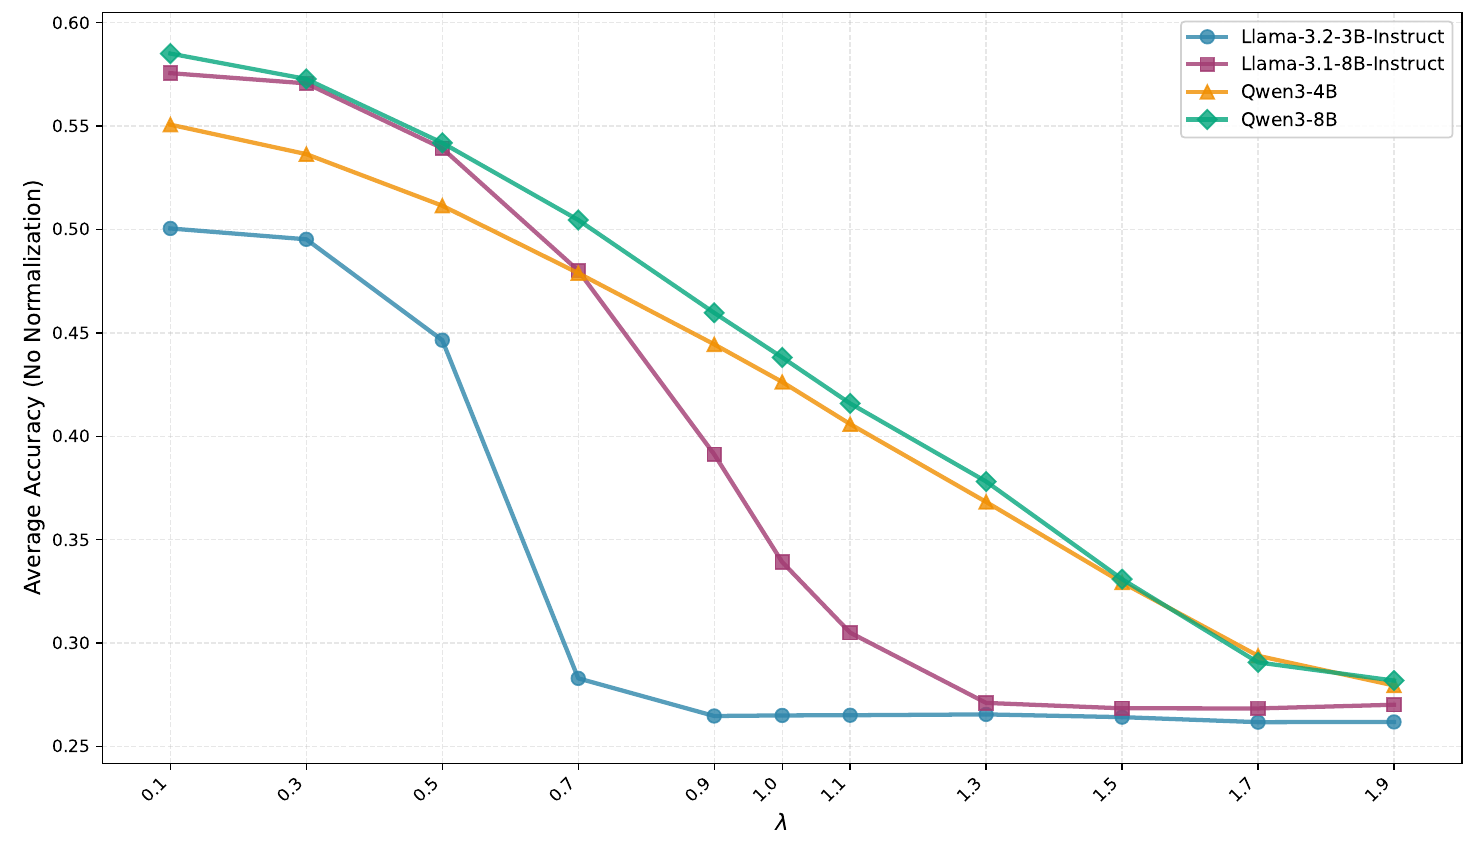
The lower decline results from summing and then amplifying multiple updates, very different from the averaged recipe above. Omitting one Boolean setting during reproduction can reverse the curve.
Discussion
Only task arithmetic consistently improves
| Method | |||||||
|---|---|---|---|---|---|---|---|
| Task arithmetic | 25 / −1.11 | 49 / −0.02 | 88 / +0.50 | 100 / +0.74 | 100 / +0.87 | 100 / +0.93 | 100 / +1.02 |
| Model Stock | 25 / −1.11 | 53 / +0.02 | 77 / +0.06 | 82 / +0.09 | 82 / +0.10 | 80 / +0.11 | 100 / +0.13 |
| TIES-Merging | 25 / −1.11 | 78 / +0.11 | 85 / +0.14 | 87 / +0.18 | 85 / +0.17 | 80 / +0.17 | 75 / +0.13 |
Averaged across the four bases, compiled from the original Table 1. Each cell gives the percentage of combinations beating the base, followed by the paper's reported mean relative improvement (%). is an individual fine-tune.
Start with . Only about a quarter of individual fine-tunes beat their own base, and the mean drops by 1.11%. Later improvements therefore cannot simply be attributed to drawing one particularly strong fine-tune.
Task arithmetic has the clearest trend. With two fine-tunes, about half of combinations beat the base. From onward, every sampled combination across all four models beats its base. Mean improvement grows with , reaching about 1% at .
Here, 100% refers to all combinations sampled in this study. Each family tests only 15 subsets at and one at , rather than every possible Hugging Face fine-tune combination. Both reported quantities matter: a high share of base-beating combinations can coexist with only a tiny average gain. They answer separate questions about reliability and improvement magnitude.
The gains are small. The authors summarize that, averaged across tasks, most improvements remain below 1%.
TIES-Merging also often beats the base, but gains quickly plateau around 0.1 to 0.2%. On Qwen3 8B, more fine-tunes make it worse: +0.16 at becomes −0.08 at . The authors argue that TIES is sensitive to task-vector magnitudes among heterogeneous fine-tunes. Model Stock stays very close to the base, with weights that barely move away from it.
Does it beat the best individual model?
Beating the base is only one comparison. The authors also ask whether merges beat the best fine-tune in the full pool. Task arithmetic does so for three of the four models, with generally more favorable outcomes for both Qwen families and Llama 3.2 3B when .
The exception is Llama 3.1 8B. Its pool contains one particularly strong fine-tune. Merging improves over the base but still trails that fixed reference. In practice, keep “select an existing model” as a baseline; otherwise, merging and evaluation may only bring you closer to an option already available.
Subspace methods: more merging, worse results
Over the preceding year or two, subspace methods such as TSV-Merge and Iso-C performed well on vision-model merging benchmarks. Rather than simply adding in full weight space, they decompose each layer's task updates with singular value decomposition and handle interference in low-rank subspaces. TSV-Merge retains each task's most important singular directions and orthogonalizes directions across tasks; Iso-C flattens the singular-value distribution.
Their transfer to in-the-wild LLM merging is disappointing. TSV-Merge and Iso-C accuracy declines as more fine-tunes are merged. The authors argue that truncation and orthogonalization progressively discard useful information during multi-model merging.
They also measure how far merged weights move from the base. Task-vector norms, , generally stay within 50 for task arithmetic, TIES, and Model Stock. Iso-C and TSV-Merge often reach 100 to 300, exceeding 300 in the two 8B models. Greater distance correlates with greater degradation. The authors interpret this as moving weights too far, outside the base model's basin, and causing catastrophic forgetting.
For a layer of shape with update , SVD gives . TSV-Merge retains roughly of each source's singular directions, then combines and orthogonalizes them; as grows, fewer directions survive per source. Iso-C decomposes the summed update and replaces every singular value with their mean, strengthening weaker directions relatively. Both alter direction combinations or their strength distribution substantially compared with averaging original deltas.
Subspace Boosting does not fail in the same way
The third subspace method deserves separate treatment. Subspace Boosting starts from a merged update, selects a cutoff based on cumulative singular values, and raises weaker singular values beyond it to the cutoff value. It can follow TA or TIES, so results are reported as TA+SB and TIES+SB, rather than as an independent model-selection procedure.
The paper fixes its threshold at 0.2. TA+SB varies greatly with few fine-tunes: at , only 23% of combinations beat the base on average. At , that becomes 100%, with reported mean improvement +1.07. TIES+SB is steadier and reaches +0.36 with twelve fine-tunes, versus −2.36 for TSV-Merge and −5.36 for Iso-C in the same setting. Subspace methods therefore have different outcomes and cannot all be described as worsening with more models. TA+SB largely follows TA's trend, with no clear, consistent additional advantage from the singular-value-spectrum operation.
A cleaner source pool
The appendix separately selects three mathematics and three medical experts for Qwen3 4B and 8B, comparing same-domain merges of three against cross-domain merges of six. Evaluation switches to corresponding mathematics and medical questions. At 8B, mixed-domain merging performs similarly to separate domain merges. TA and TIES also preserve performance at 4B, while some subspace variants show larger gaps.
This makes the main experiment more informative. A random pool may combine overlapping updates pointing in different directions. Establishing each source's strengths and selecting a purposeful combination can give different results. The main experiment deliberately omits alignment, clustering, and candidate filtering, so its findings do not settle the value of every carefully selected recipe.
Distance analysis also belongs within this scope. Within a family, larger update norms correlating with poorer scores provide a useful anomaly signal. Across parameter counts or different network normalization, absolute values cannot share a universal cutoff of 50 or 300. The authors use distance to support their hypothesis of leaving a favorable region; they do not directly measure loss barriers along every candidate's path.
Conclusion
The study's conclusion has two parts.
The encouraging result is that community fine-tunes with varied, potentially conflicting objectives can still merge into a model better than its base. The oldest, simplest task arithmetic does it, becoming more reliable as more fine-tunes are included.
The gain remains limited. TIES and Model Stock stay close to the base, some subspace recipes degrade, and TA+SB largely follows TA's trend. Source-pool selection, normalization, and fixed evaluation prompts all matter when interpreting these scores.
If you have a collection of fine-tunes from the same base with varied origins, try task arithmetic first. Before moving to a more elaborate method, measure how far the merged weights have moved from the base.